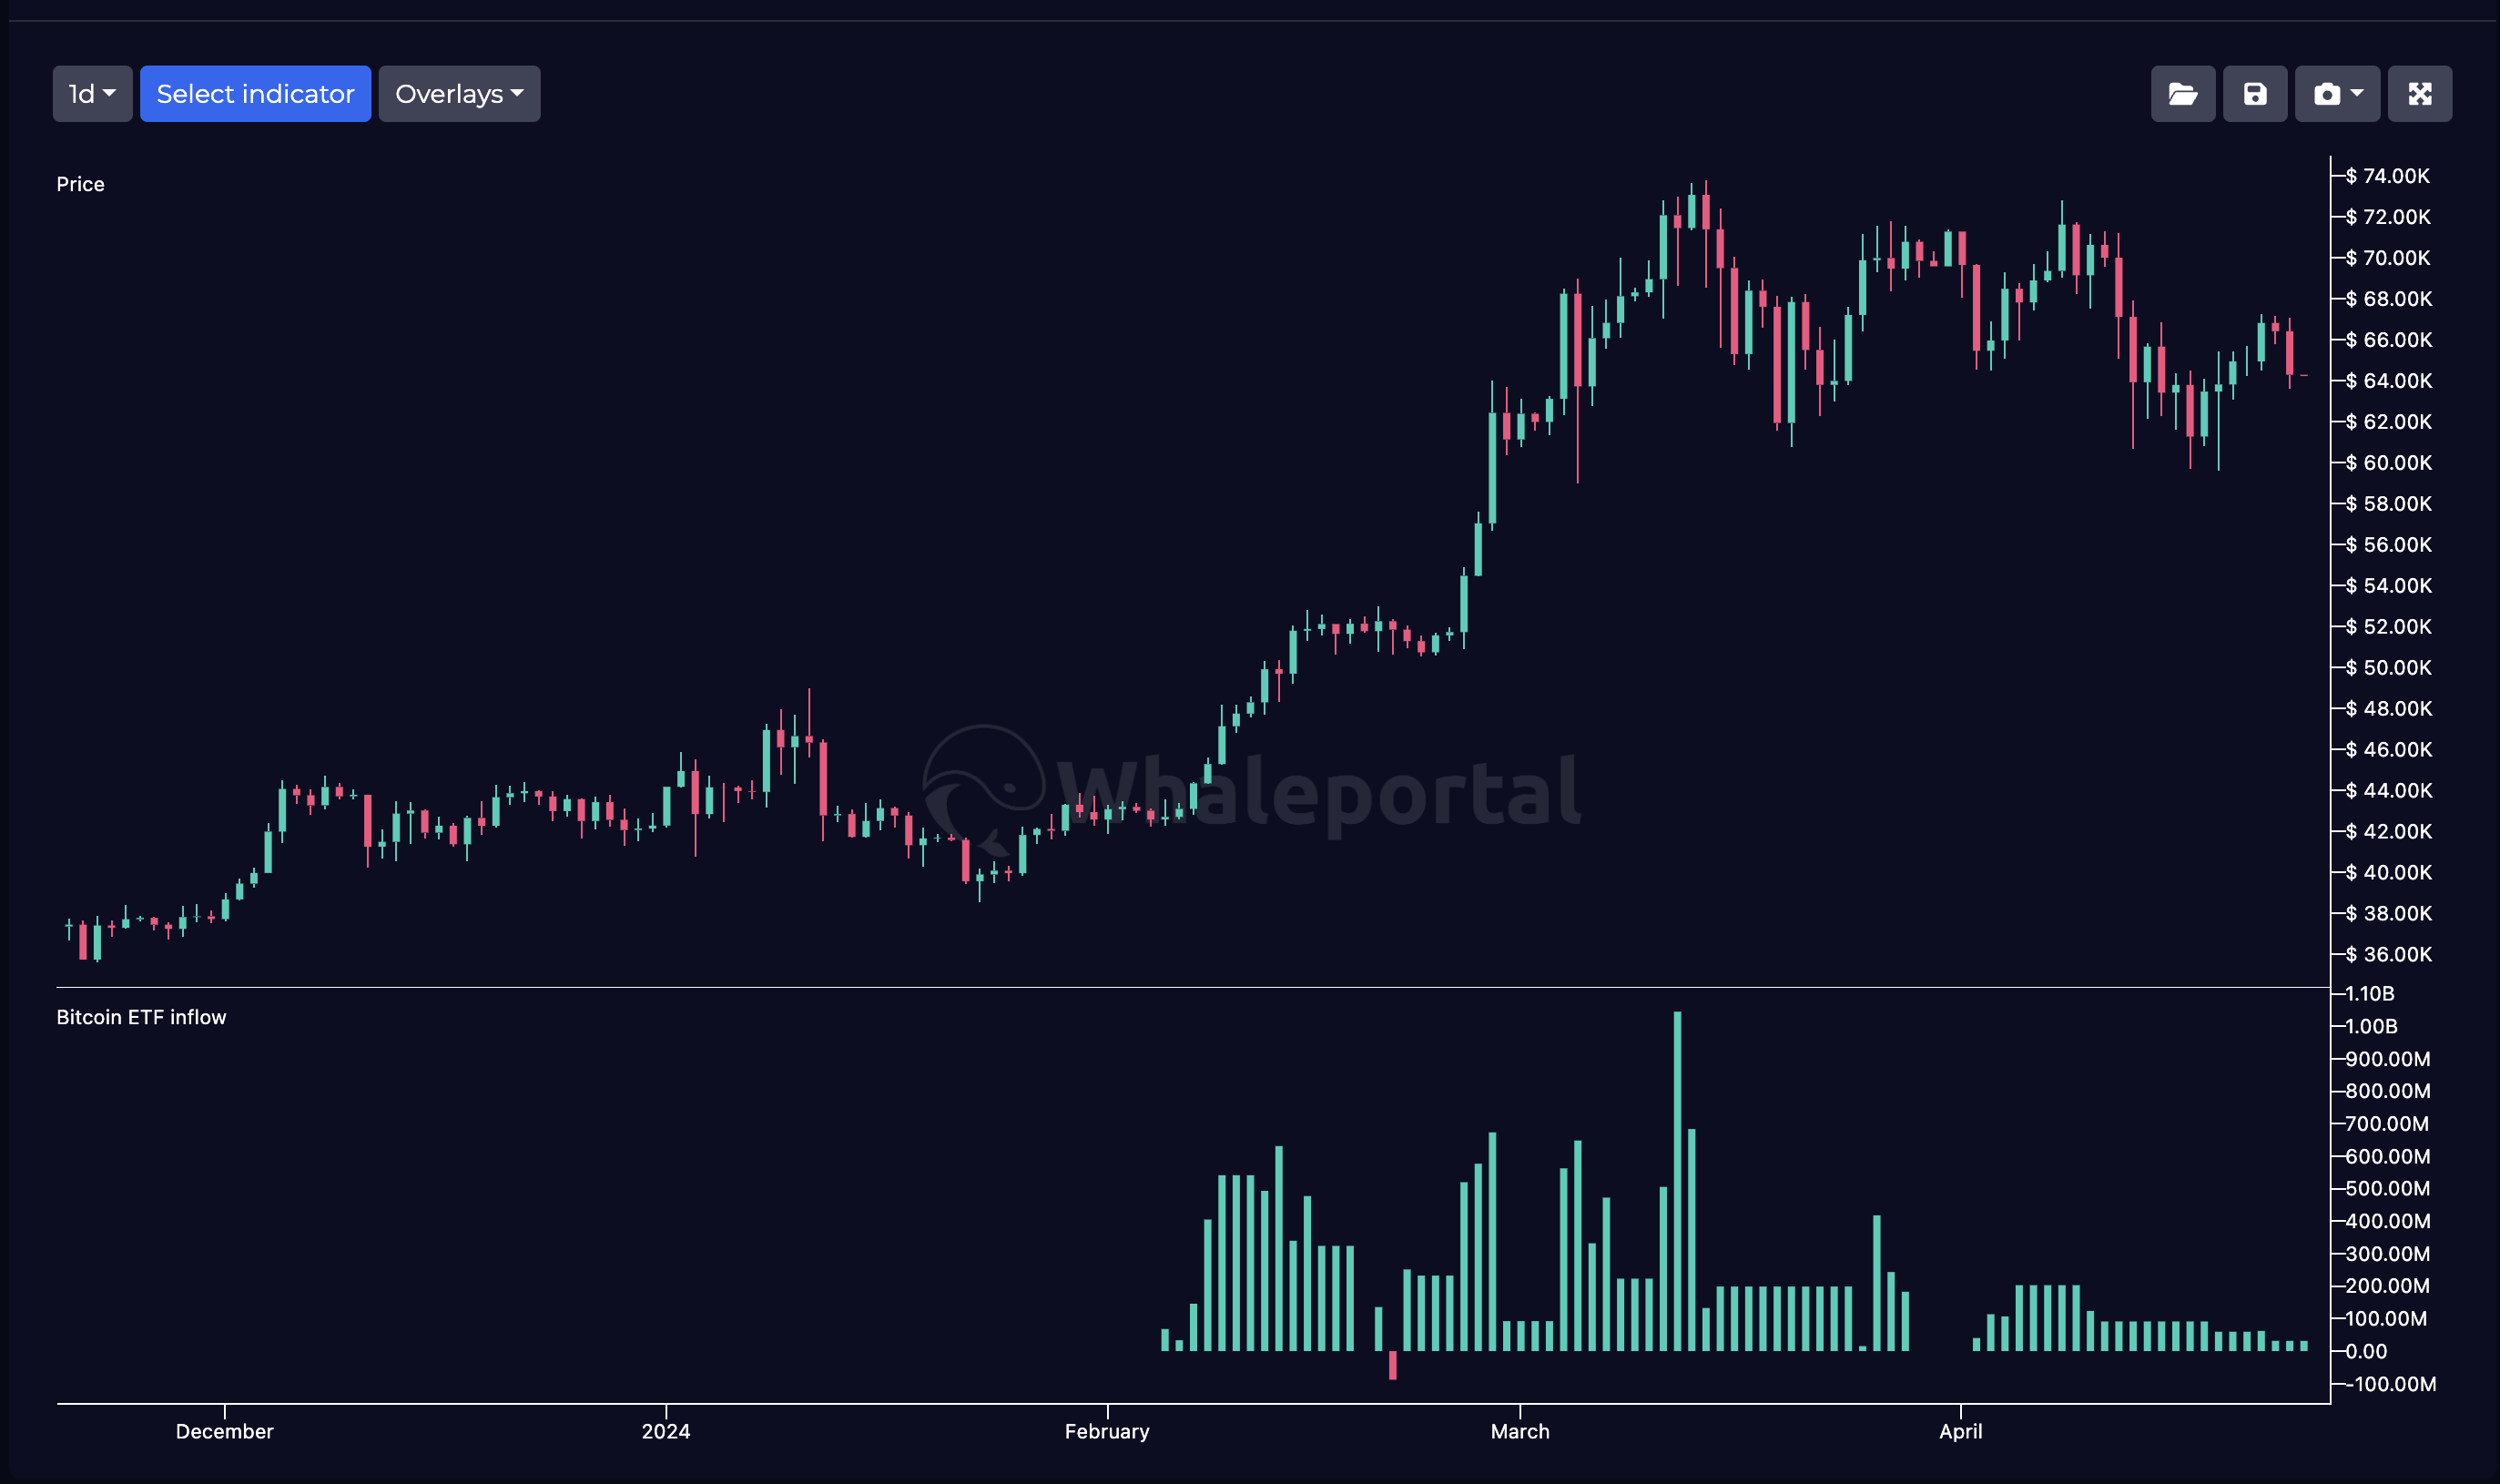
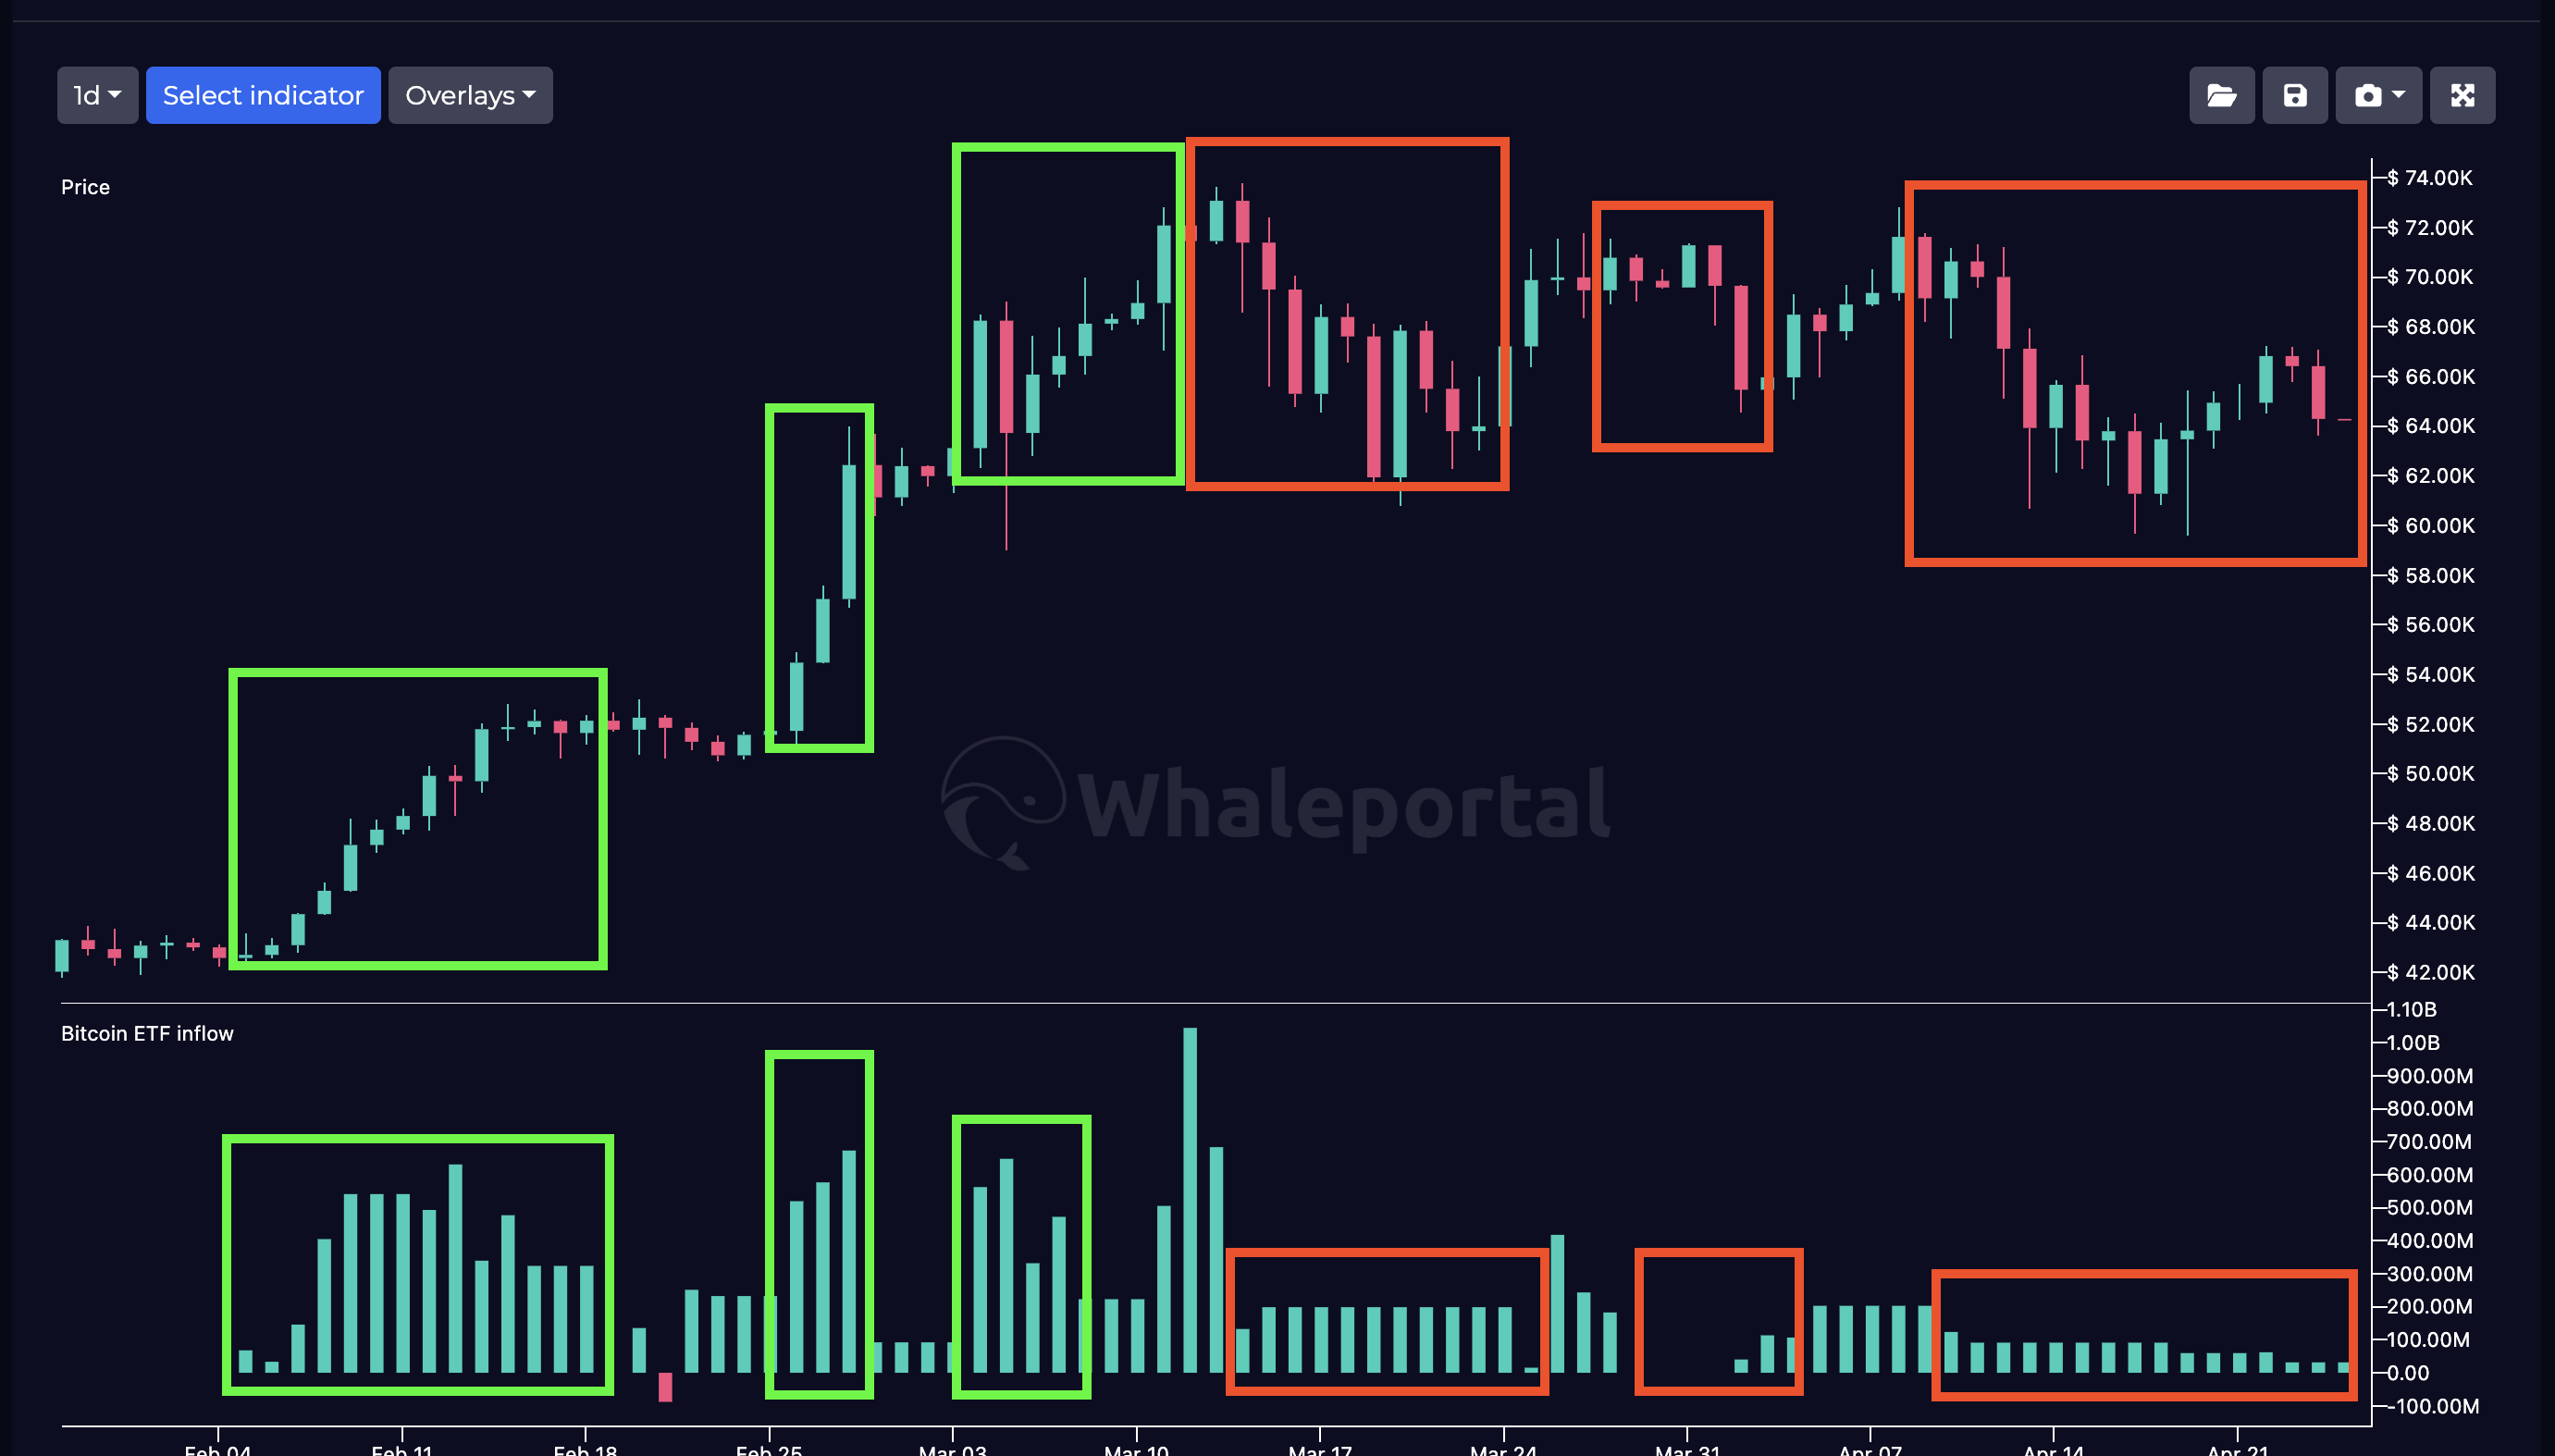
Bitcoin ETF inflow chart compared to the Bitcoin price
The Bitcoin spot ETF has been probably the biggest story of 2024, where institutions and individuals an invest in Bitcoin through traditional finance. In this article we’ll dive into what the Bitcoin ETF actually is, what kind of effect it has on the Bitcoin price and how you can view the Bitcoin ETF inflow chart.
What is an Bitcoin ETF?
ETF stands for “exchange-traded fund” which basically means that Bitcoin is tradable on traditional and regulated exchanges. The latter is probably most important. Institutions and individuals can basically go to their bank or portfolio manager and buy a Bitcoin spot ETF to get exposure to Bitcoin. The Bitcoin spot ETF is backed by real Bitcoin so the company offering these ETF’s have to buy physical Bitcoin.
Which Bitcoin ETF’s are there?
There are many different companies that offer exposure in Bitcoin through a Bitcoin ETF. Here are a couple of examples:
- Bitwise Bitcoin ETF (BITB)
- VanEck Bitcoin Trust (HODL)
- iShares Bitcoin Trust (IBIT)
- Grayscale Bitcoin Trust (GBTC)
Why is there so much buzz around these ETF’s?
Investors believe that through a regulated Bitcoin ETF, traditional finance is more likely to invest into the asset class because an ETF makes it easier for regulated institutions to invest in Bitcoin. Institutions and individuals can just go to their bank or broker and add Bitcoin to their investment portfolio.
Bitcoin ETF inflow chart
To really see the effect of the Bitcoin spot ETF on the Bitcoin price, we need to have a look at the Bitcoin Spot ETF indicator. The Bitcoin spot ETF indicator is chart which shows the amount of dollars that where flown into the ETF's. Therefor we can see on a daily basis, how much money entered the Bitcoin spot ETF markets.
Correlation Between Bitcoin ETF and Bitcoin price
If we look closely and compare the price of Bitcoin with the amount of inflows in the Bitcoin spot ETF we can see a clear correlation. When lots of Bitcoin ETF’s are sold, the price of Bitcoin goes up and when we are seeing not many Bitcoin ETF buys the price either goes sideways or down. This is also quite a logical reaction as the Bitcoin spot ETF needs to be backed by real Bitcoin and therefor, the companies offering the Bitcoin ETF’s need to buy physical Bitcoin which causes the price to go up as there is more money flowing into Bitcoin.
While this correlation can provide valuable insight into institutional demand, it’s important to combine this data with other tools to get a complete picture of the market. Many traders therefore look at which indicators actually work to confirm price direction alongside ETF inflows.
Conclusion
The price of Bitcoin is derived from the supply and the demand. Basically the more people want to buy Bitcoin, the higher the price. This is because Bitcoin has a limited supply unlike corn for example. When the demand increases the supply can increase as well by planting more crops. So when we see money flowing into Bitcoin ETF’s that needs to be physically bought by the companies it can drive the price up of Bitcoin as it scoops Bitcoins off the market. This Bitcoin ETF indicator is a great tool traders can use to see the demand in among institutions and traditional finance.