The Bitcoin 4-Year Cycle: A Guide to Understanding and Leveraging the Cycle with Whaleportal
Introduction
The world of Bitcoin and cryptocurrency at large is fascinating and offers intriguing financial opportunities. One of the most compelling patterns within this sphere is the Bitcoin 4-year cycle, a phenomenon that all serious Bitcoin traders need to comprehend to maximize their trading potential. This guide presents an in-depth look at this cycle, and how the Whaleportal trading dashboard can help traders effectively leverage it.
Understanding the Bitcoin 4-Year Cycle
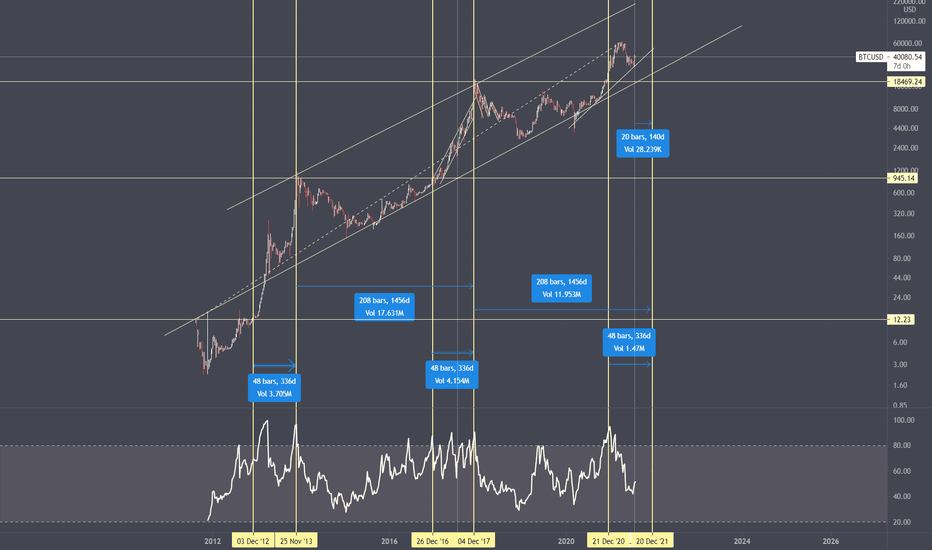
The Bitcoin 4-year cycle is a pattern rooted in the cryptocurrency's very design. It's tied to the halving event that happens approximately every four years, during which the reward for mining Bitcoin blocks is halved. This event impacts Bitcoin's supply, often triggering a price increase due to the scarcity principle.
The cycle is typically divided into four phases:
- Accumulation Phase: After a bear market, the price stabilizes, and smart investors start to accumulate Bitcoin.
- Expansion Phase: The price starts rising gradually, drawing in more investors.
- Explosion Phase: The halving event occurs, causing a significant surge in price due to increased demand and decreased supply.
- Reaccumulation Phase: After reaching a peak, the price drops sharply, creating a bear market where investors accumulate Bitcoin in preparation for the next cycle.
This cycle is a crucial element to understand as it can guide traders on when to buy, hold or sell Bitcoin.
Leveraging the Bitcoin 4-Year Cycle with Whaleportal
Whaleportals is a comprehensive trading dashboard designed specifically for Bitcoin and cryptocurrency traders. The platform provides data such as Bitcoin funding rates, Crypto Fear and Greed Index, Taker Buy/Sell ratio, and more. Here's how you can leverage these features to take advantage of the Bitcoin 4-year cycle:
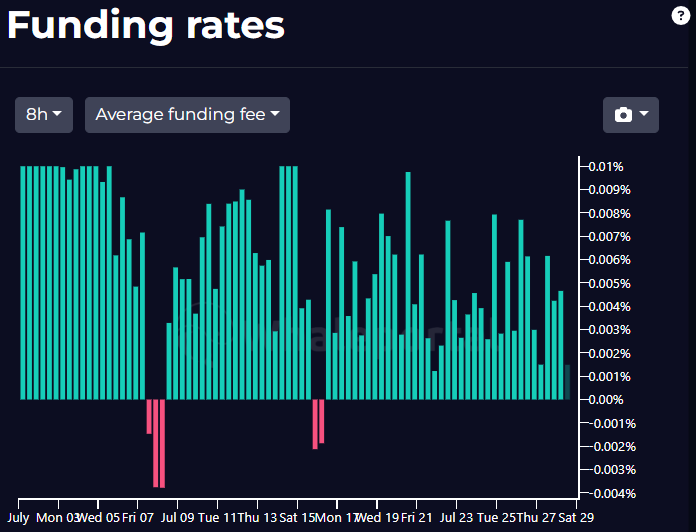
Bitcoin Funding Rates
This metric tells traders about the cost of holding open positions in Bitcoin futures. Low funding rates during the accumulation phase might signify a good time to open long positions, whereas high rates during the explosion phase could indicate that it's time to take profits.
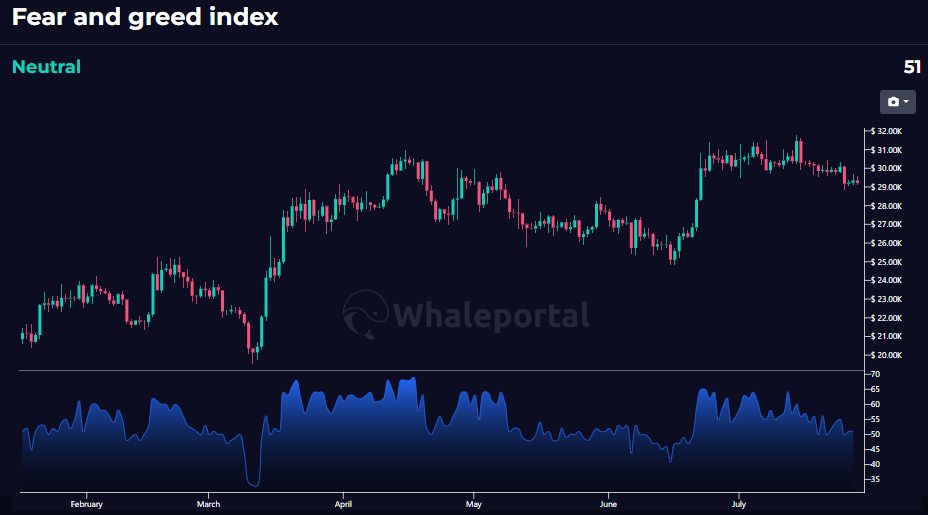
Crypto Fear and Greed Index
This index measures the general sentiment in the market. Fear indicates a potential buying opportunity (accumulation and reaccumulation phases), while greed often aligns with selling or shorting opportunities (explosion phase).
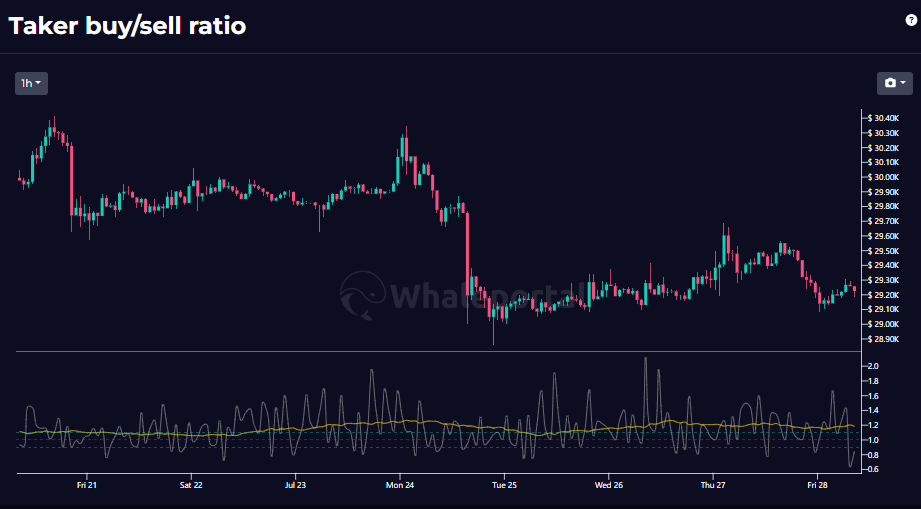
Taker Buy/Sell Ratio
This ratio gives insights into market direction based on trading activity. A high ratio signals more buying activity, which usually corresponds with the explosion phase. Conversely, a low ratio, indicating more selling, aligns with the reaccumulation phase.
Using Whaleportals for Strategic Decision-Making
The power of Whaleportal lies in its ability to present complex data in an easily digestible format, aiding traders in making informed decisions. The platform's tools offer a more granular view of the market, allowing users to pinpoint the different phases of the Bitcoin 4-year cycle more accurately. This becomes even more powerful when you understand crypto trading indicators and how to combine them to confirm each phase of the cycle.
To illustrate, let's say you notice a low Bitcoin funding rate and a high fear index on Whaleportals. This might indicate that the market is in the accumulation phase, signaling a potential buying opportunity. Conversely, if you see high funding rates and a strong sense of market greed, you might be in the explosion phase and could consider selling or taking profits.
Moreover, the Taker Buy/Sell ratio can act as a helpful pulse check on market activity. A higher ratio may point towards the expansion or explosion phase as more buyers enter the market. A lower ratio, on the other hand, may suggest that you're in the reaccumulation phase, with an increase in sellers and potential price drops.
Conclusion
Understanding the Bitcoin 4-year cycle is a fundamental aspect of successful Bitcoin trading. The cycle's predictability can guide traders on the appropriate times to buy, hold, or sell Bitcoin. With a platform like Whaleportal, traders can tap into robust metrics and data visualizations to navigate this cycle more effectively and make informed decisions that align with their investment goals.
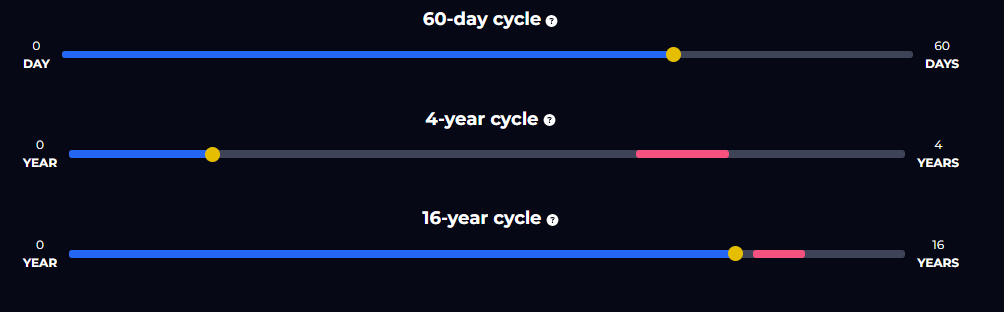
You can see where we are exactly in the 60 day, 4 year and 16 year cycle.