The Bitcoin Premium Index
What is the Bitcoin Premium Index?
The Bitcoin Premium index tracks the premium or discount of Bitcoin perpetual contracts relative to the spot index price per minute. The premium Index is based on the difference in price between the last traded price of a perpetual contract and the spot index price. The spot index price is a volume- weighted spot index, which means an average price taken from multiple exchanges.
Basically, it shows you for each cryptocurrency whether the spot market is trading higher or lower than the perpetual contract. The value can either be above, below, or equal to 0. When the value is above 0, the perpetual contract is trading higher than the “mark price”, when the value is below 0 the spot index is trading higher than the perpetual contract.
How to read the Bitcoin premium index?
There are multiple ways to view the Bitcoin Premium Index. You can either look at the value (above or below 0) similar to the funding rates or you can look at certain extremes. This information can be very helpful in your trading strategy. The chart is displayed as a candlestick chart with a body and the wick (also known as shadow) of the candle. The wick can show a certain extreme, while the close of the candle shows the value.
The value, either above or below 0 shows whether the price of Bitcoin perpetual contracts is trading higher or lower than the spot index. When the spot index is trading higher, the premium will go below 0 and turns negative, usually, this is known to be a bullish sign. When the value is trading higher than 0 and turns positive, it means the Bitcoin perpetual contract is trading higher than the spot index, usually, this is seen as a bearish signal.
The markets are a reflection of human emotions and often before the price can shift we are seeing a certain extreme in emotions. That extreme can be spotted in the Premium Index. When we have an extreme signal in the Bitcoin Premium Index the chances of a reversal increase. This can be either a short-term reversal or a bigger reversal.
In short, a spot index premium is usually bullish and a derivatives premium is usually a bearish signal.
But as with funding rates, it sometimes takes a moment for that buying or selling pressure to be expressed in the price and therefore it is always important to combine this metric with other metrics like the price structure.
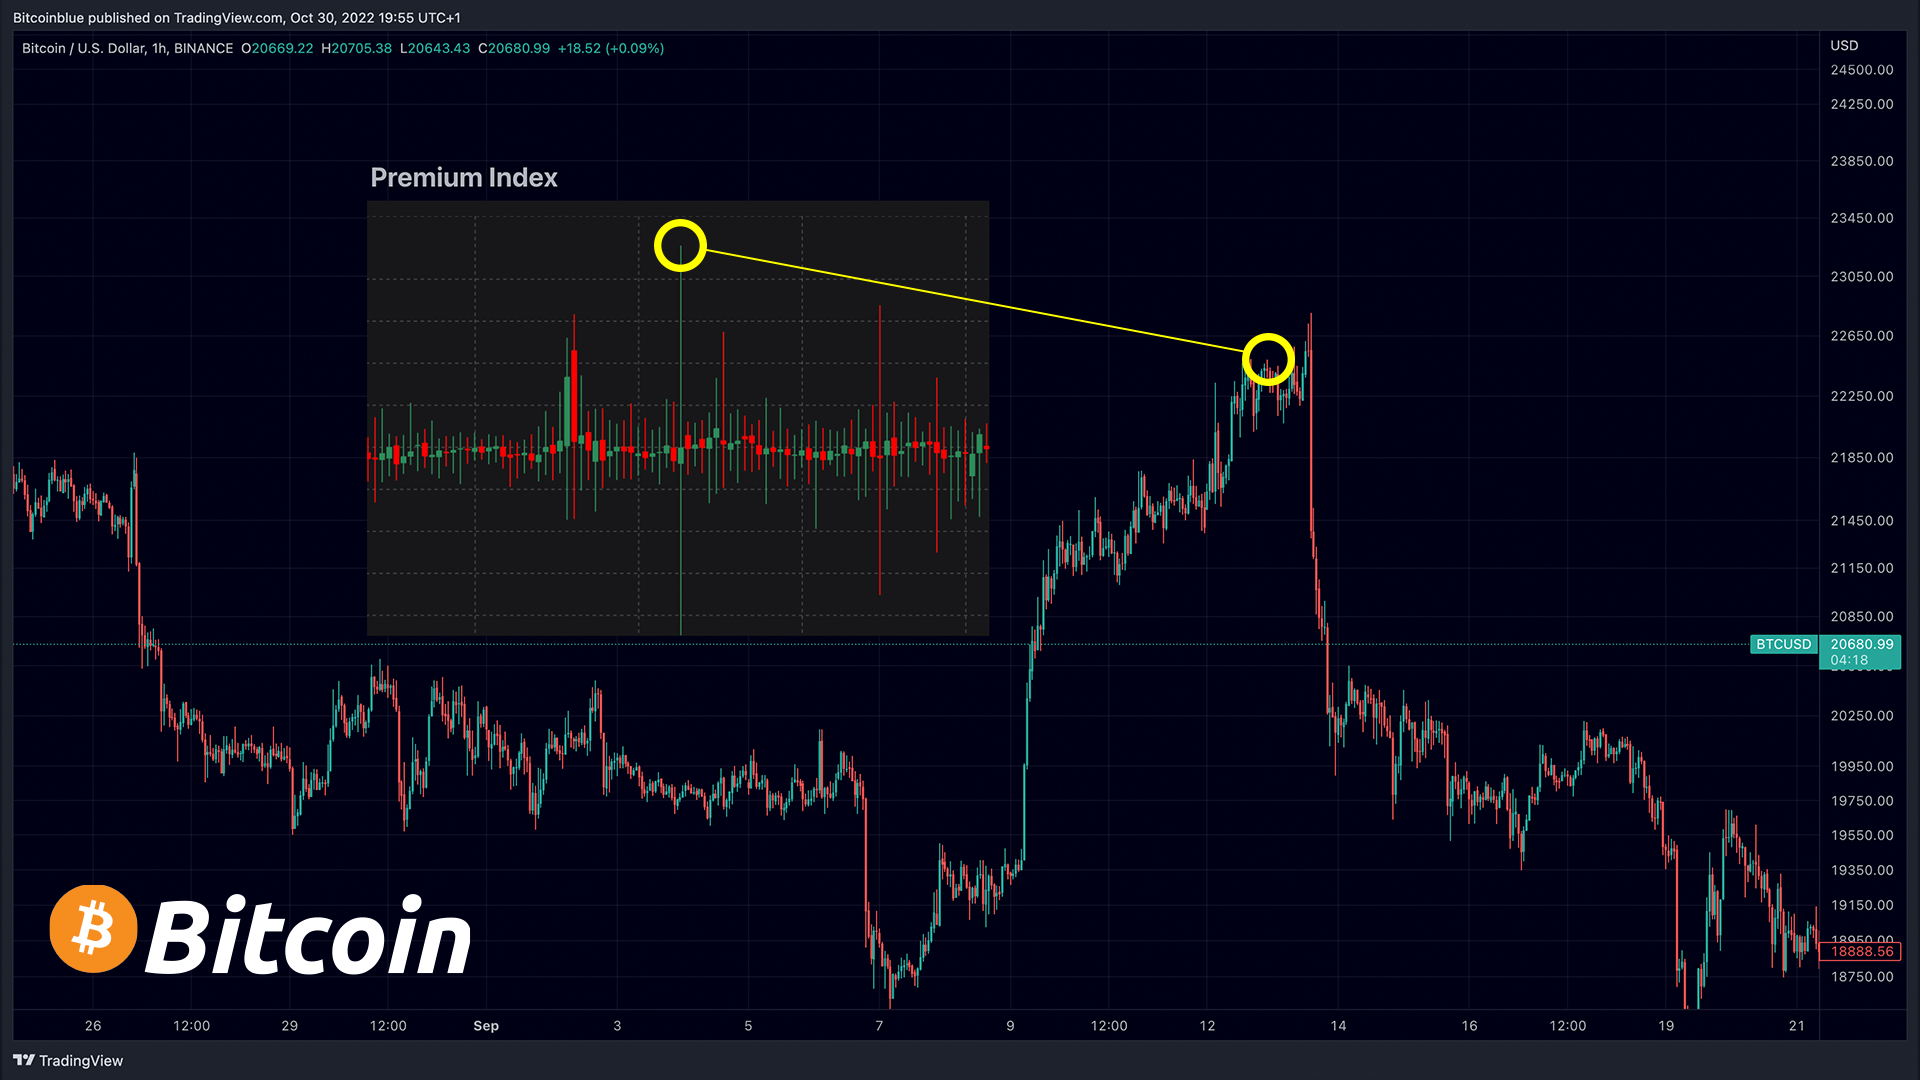
For example, here in the image below we can see an extreme reading in the premium index on Bitcoin. Although in several hours after the event we still see the price climb, we do see that it’s rather close to a reversal and eventually the price turns around.

The premium index on Whaleportal
Most crypto exchanges offer different contract types, the most common contract types are USD or BTC settled. The main difference between those is that one contract is settled in USD and the other one in Bitcoin (BTC).
At Whaleportal we look at both contract types and calculate the average between them. This ensures that you will get precise and accurate information on whether there has been an extreme reading in USD, BTC settled contracts, or both of them.
You can also look into historic events, this makes it possible to find certain signals in the past and compare them to the price action.
Summary
The premium index might be one of the most hidden metrics amongst traders as there are not many who publicly use this metric. This can give traders who do understand and use this metric a big advantage over the other market participants. This metric can be used for either price direction or spotting reversals. Price direction is similar to funding rates and reversals through extreme readings.