Bitcoin 16-year Cycle
The 16-year asset class cycle
Every asset class goes through an adoption cycle. There is a moment when the asset class is introduced and the first investors are entering, till the moment that every single person has heard of this new asset class and most might even have some exposure. Analyzing these adoption cycles can be very helpful in terms of investing. It can tell you whether it’s worth it to take risks and have exposure or whether the market is very mature and it’s better to reduce exposure.
The 16-year Dotcom cycle
A famous cycle we’ve all heard of is the dot-com cycle. The dot-com cycle, also known as the “internet bubble” is an economic cycle that is characterized by a rapid economic expansion followed by a contraction. This new technology is creating opportunities and expectations among the public and therefore can see a rapid economic expansion. However, this rapid expansion is followed by a contraction to re-balance the ebb and flow of the markets. Nothing can remain overbought forever. In every rally, the seed for a correction exists, and every correction contains the seed for a new uptrend.
The dot-com cycle can be roughly seen as a 16-year cycle, from 1987 to 2003. The invention of the technology of the internet might be earlier than 1987, but the asset class cycle started around 1987 after a big crash in the financial markets.
The 4-year cycle
The 16-year cycle of the dot-com bubble can be divided into 4 x 4-year cycles. Where generally we see 3 years of expansion, followed by 1 year of contraction except for the last 4-year cycle.
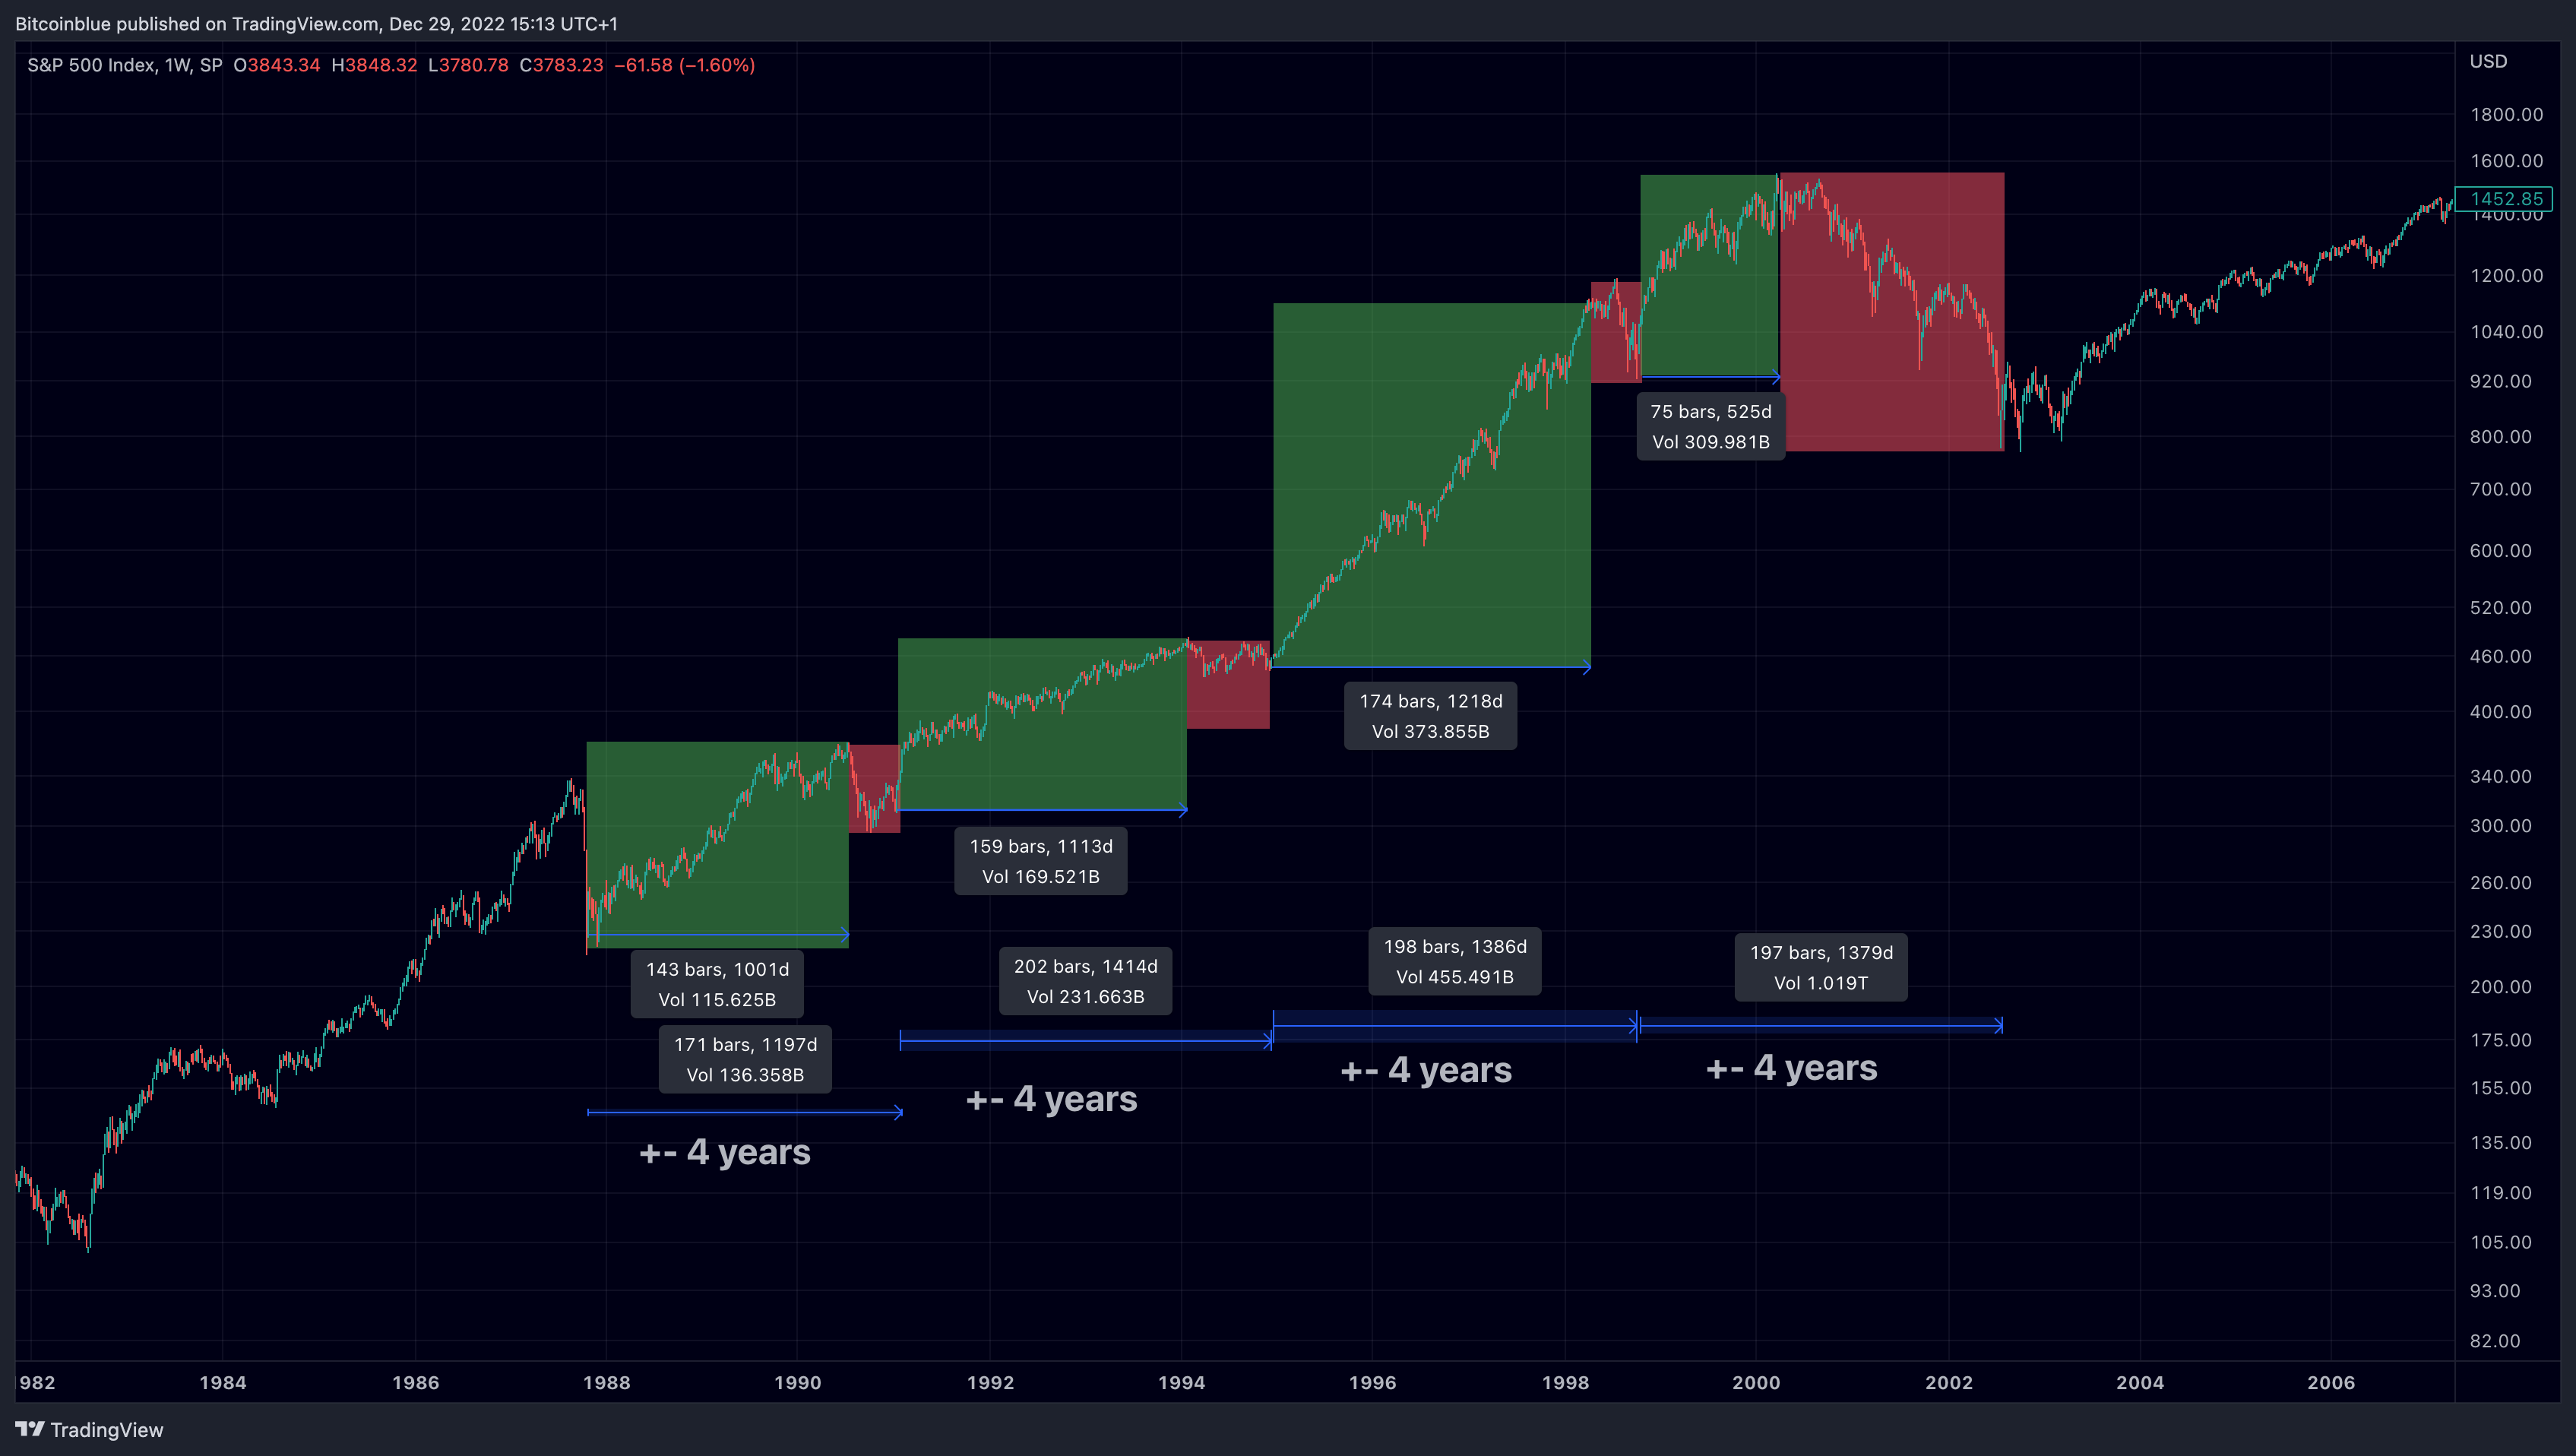
1.1 16-year dot-com cycle divided into 4-year cycles.
The last 4-year cycle was the other way around, whereby there was +- 1 year of expansion followed by 3 years of decline. This marks the end of the 16-year cycle.
4-year Bitcoin cycle
Bitcoin acted in a similar way so far. We’ve seen 3 times a 4-year cycle in Bitcoin. This 4-year journey was even documented by Bob Loukas, a well-known market analyst. The first 3 4-year cycles were similar a the first dot-com cycles with 3 years of expansion followed by a 1-year contraction.
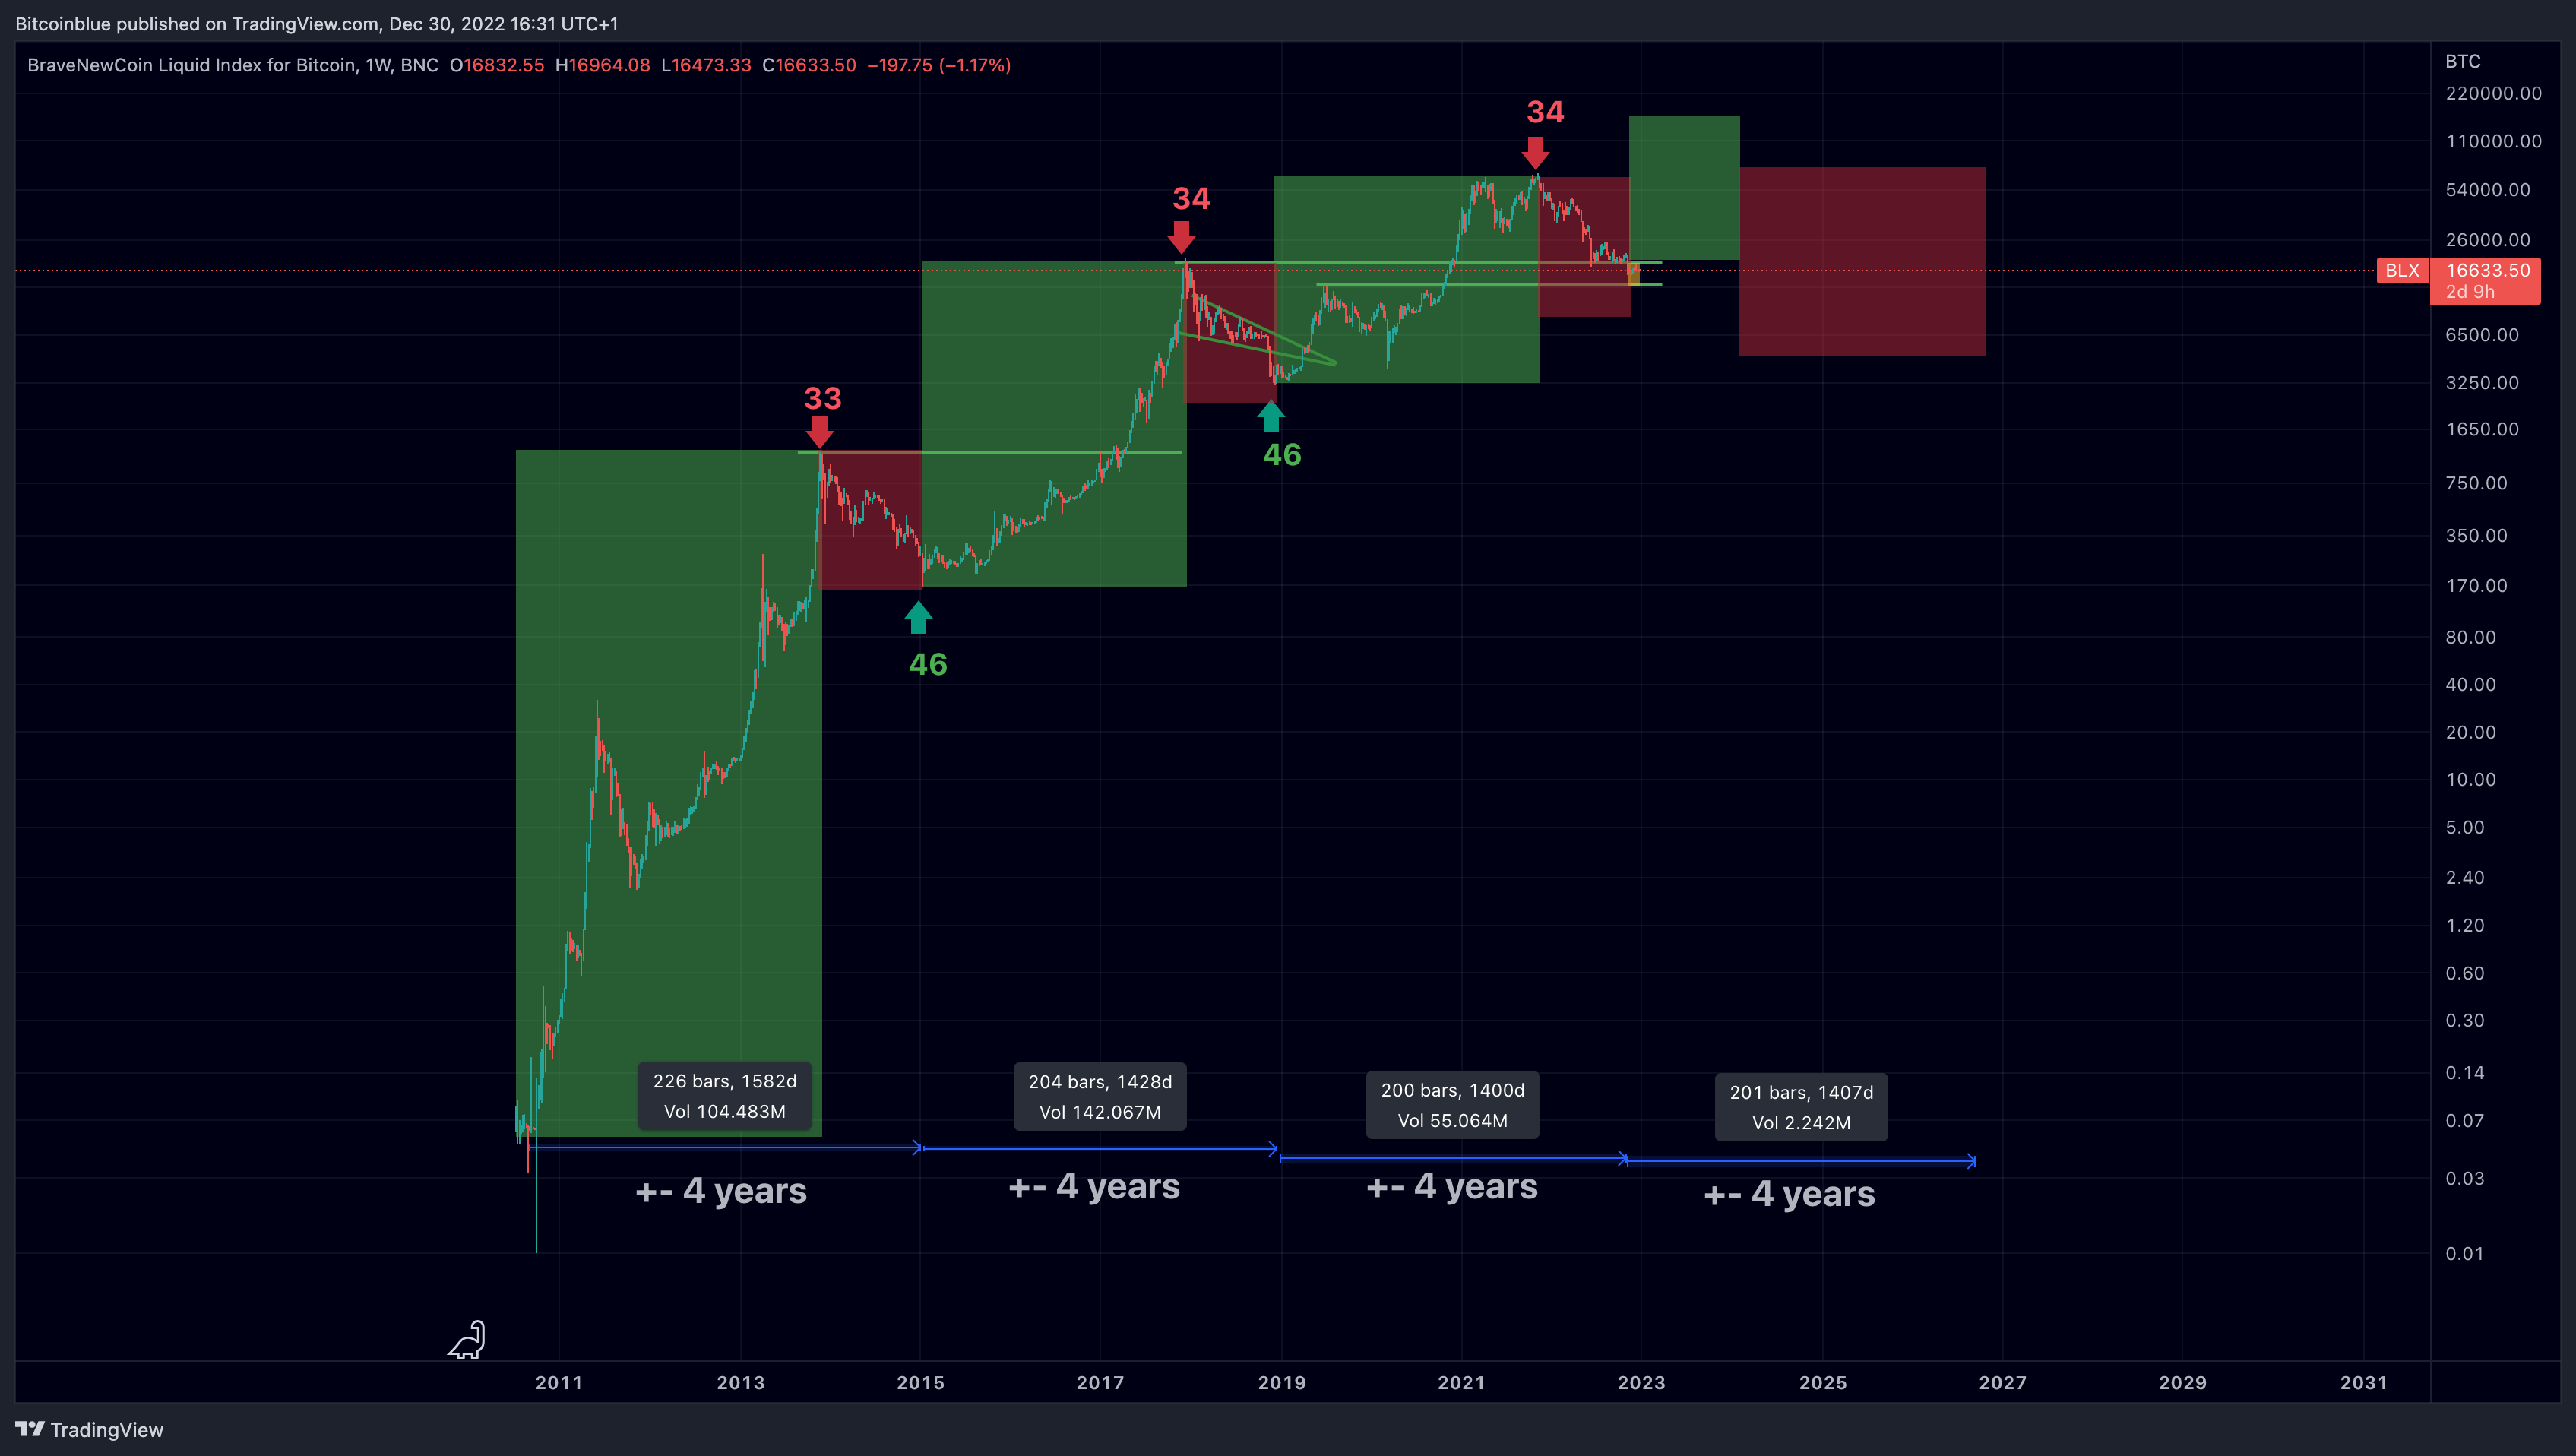
1.2 4-year cycles Bitcoin chart
In the image above you can see the 4-year cycles for Bitcoin. A green and red box combined represents 1 4-year cycle. The green box represents the expansion phase of the cycle and the red box the contraction (correction) phase of the cycle. It’s clearly visible if we have a look at the 12-month chart for Bitcoin where every candle represents 12 months.
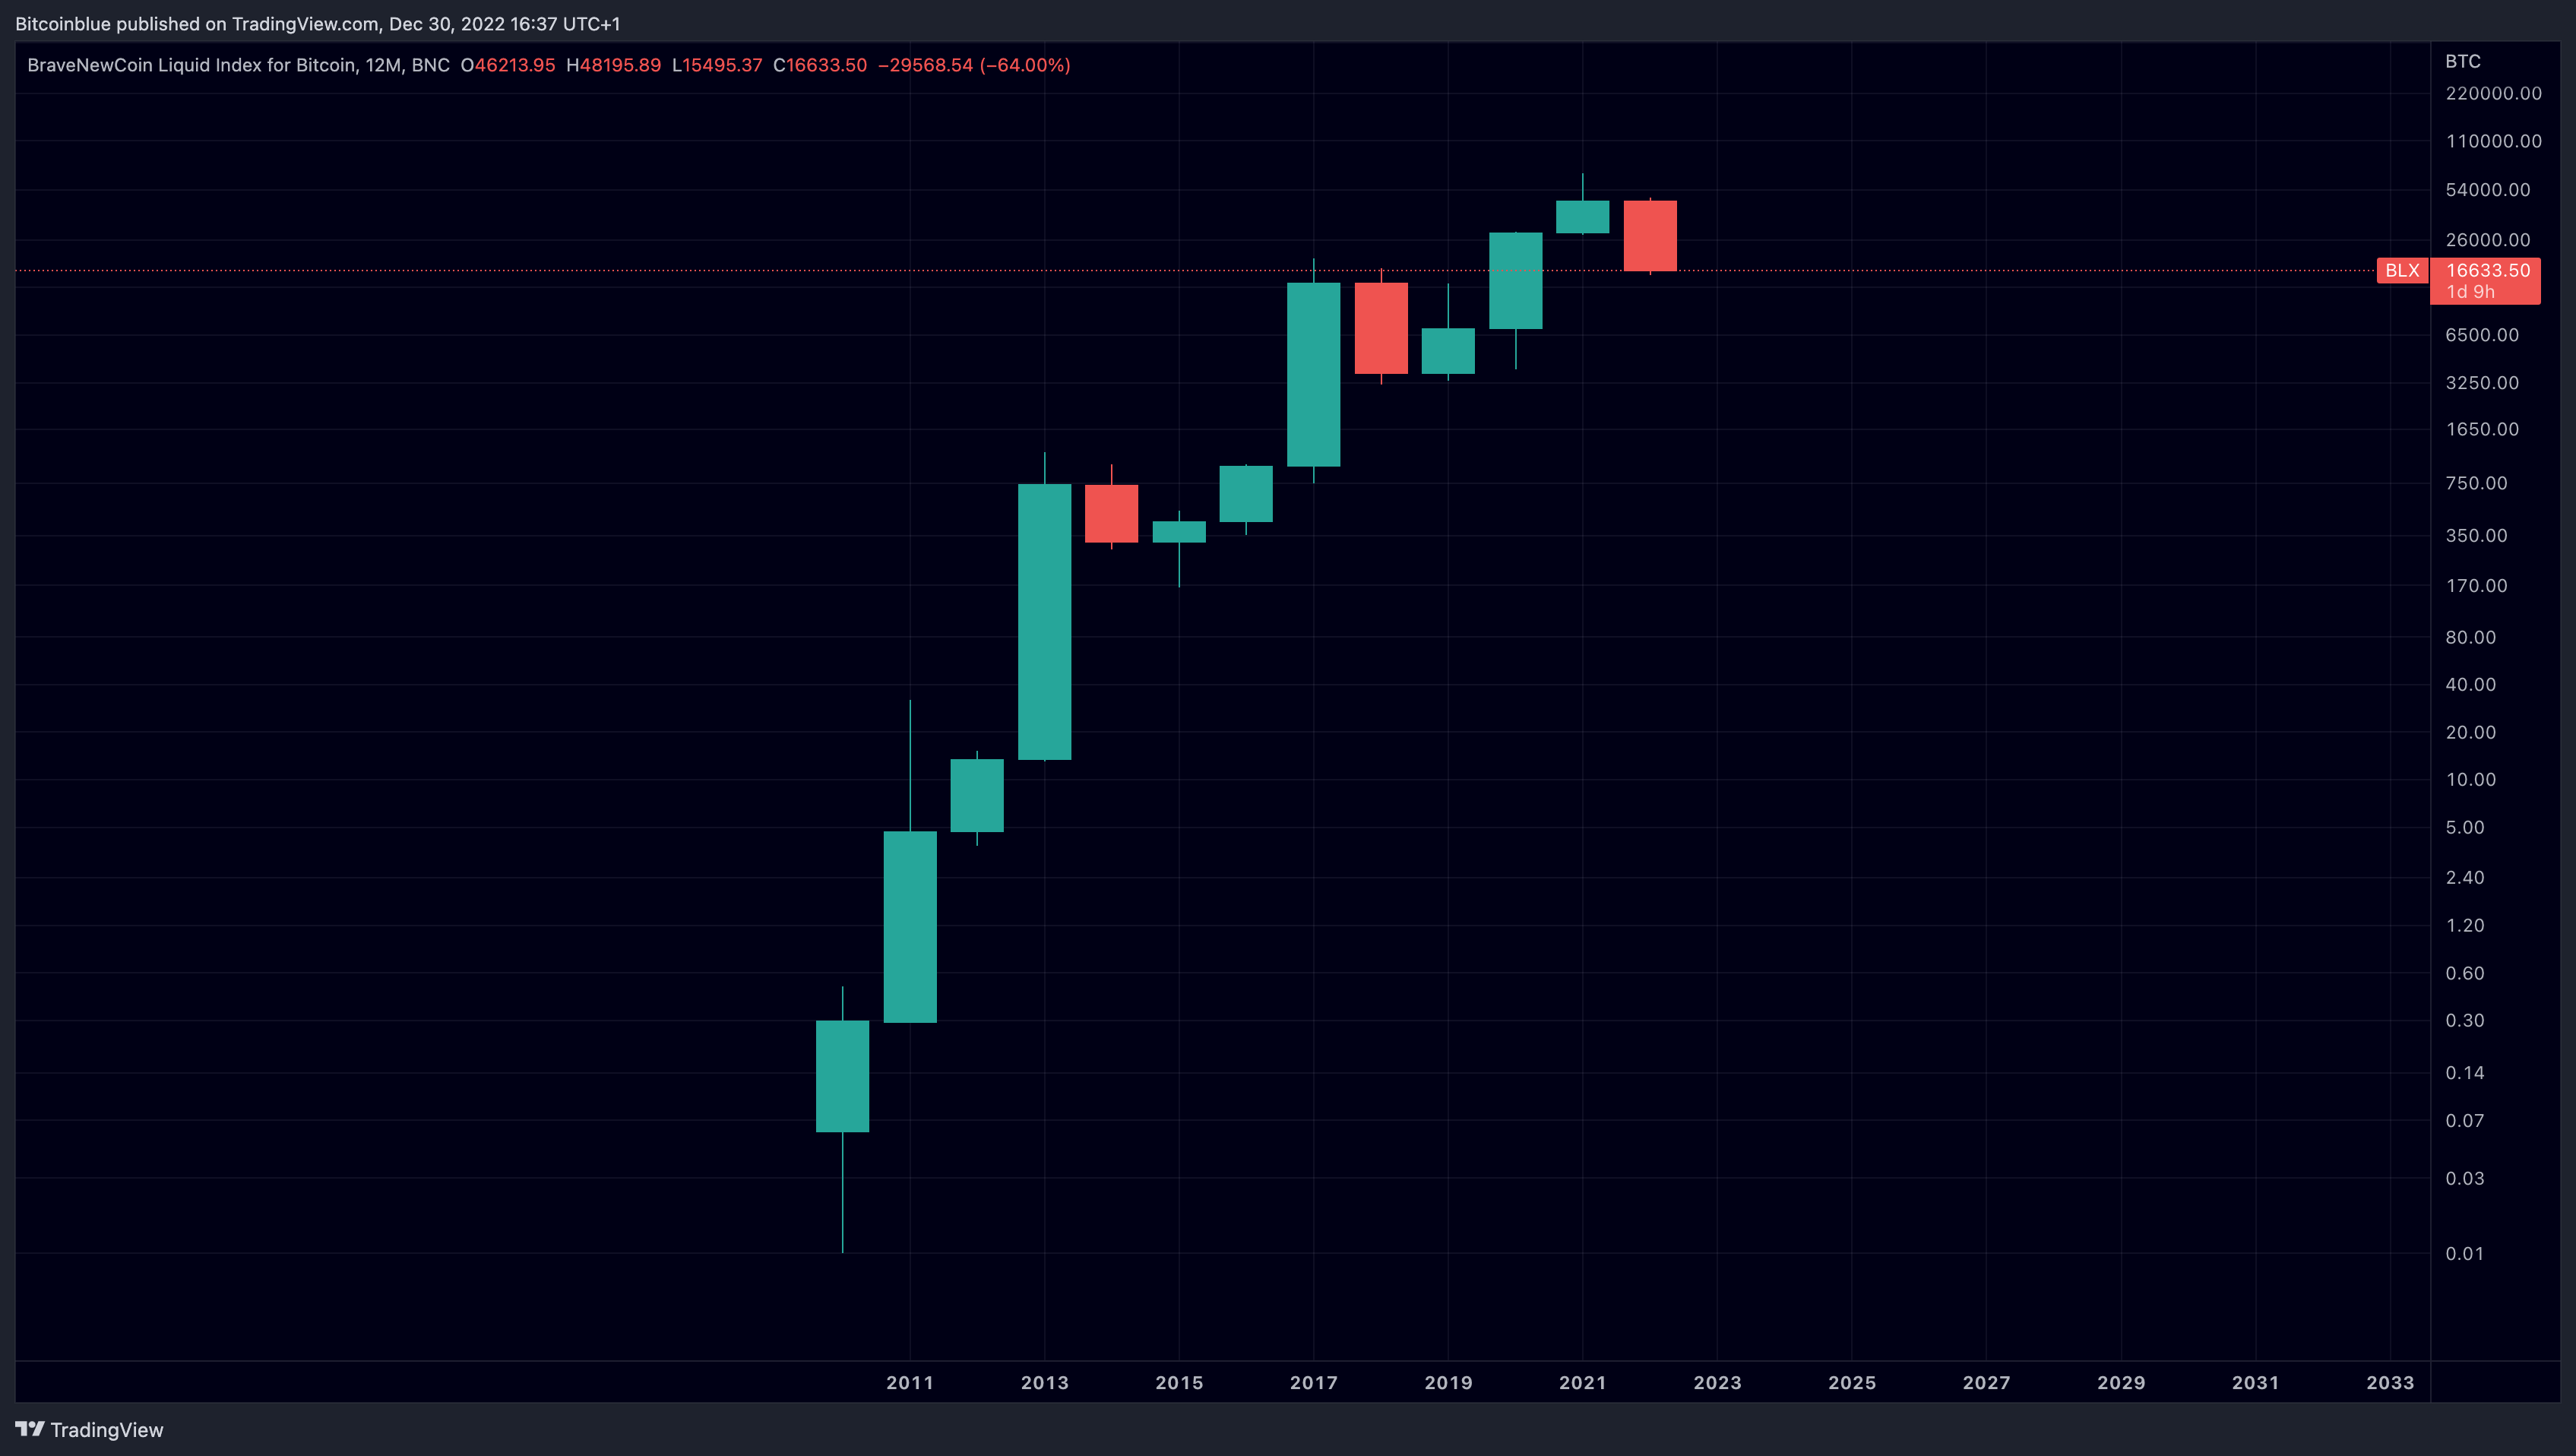
1.3 Bitcoin 12-month chart
The first green candle doesn’t represent 1 full year and Bitcoin started to trade around July 2010.
On the chart, a 4-year cycle looks like 3 green candles followed by 1 red candle. Basically presenting 3 years of price action going up (expansion) with a 1-year price decline (contraction).
Bitcoin and the dot-com bubble
Markets move in extremes due to the emotional side of the investors. When there is extreme enthusiasm, asset classes could easily reach overbought levels and become an economic bubble. We’ve seen this in the dot-com bubble, where investors’ enthusiasm reaches an extreme with the introduction of internet companies and prices greatly exceed the asset’s intrinsic value (the price doesn’t align with the fundamentals of the asset). Sooner or later the bubble will burst and prices will see a crash returning to their intrinsic value or even lower. This is exactly what we’ve seen in the dot-com cycle but as well in Bitcoin when we look at 4-year cycles. The dot-com cycle as Bitcoin could be divided into 4-year cycles. Investors’ behavior with new asset classes from a macro perspective seems quite similar.
Could we compare the dot-com 16-year cycle with the current cycle of Bitcoin?
Bitcoin so far has seen a similar path of price action to the dot-com cycle. The only difference so far is that the 16-year cycle of the dot-com cycle already has been completed. Also, I do want to point out that the period of contraction with the dot-com cycle looks slightly shorter than in Bitcoin, however, you can’t deny that both “bubbles” are looking very similar in terms of price action. If Bitcoin were to continue to follow the path of the dot-com cycle, we might see a “turned around” 4-year cycle happening next. Where Bitcoin will see 1 year of expansion followed by a 3-year contraction.
16-year cycle and Sunspot Cycle
It’s very interesting to compare different cycles with each other to see whether there is any confluence. Interestingly, another cycle also points out a potential market top for the digital currency around 2024. This cycle is the Bitcoin sunspot cycle. Could both cycles point to a macroeconomic top in the asset class around the year 2024?