Sunspot Cycles and Bitcoin
Does the Sunspot cycle have an impact on the financial markets?
The sun is in the center of our solar system and has a huge effect on our planet in terms of weather, ocean currents, seasons, and climate. The sun makes all life possible on earth and the existence of our earth would not be possible without the sun. Countless ancient societies like the ancient Egyptians, the Mayans, and the Incas worshipped the sun as the source of all forms of life. Could it be possible that the sun and its radiance on us have an even broader impact than what we might think? Could the sun's radiance also be the cause of mass human emotional behavior? And could that correspond with the financial markets?
Sunspot Cycle
A solar cycle on average takes 11.2 years. Some were as long as 17 years and some only took 7 years. The tops of these cycles are characterized by sunspots, which produce solar flares. Solar flares can cause electrical grid breakdowns, plane crashes, and radio interference. Alexander Chizhevsky, a Russian scientist believed that the peaks in solar flares correspond with extreme situations on Earth, he called this the “Excitability Factor”. Alexander thought that these high levels of solar activity are responsible for civil wars, riots, and revolutions and negatively affect human health.
 1.1 Peaks in solar cycles often are accompanied by extreme events on earth.
Sunspot cycles and recessions
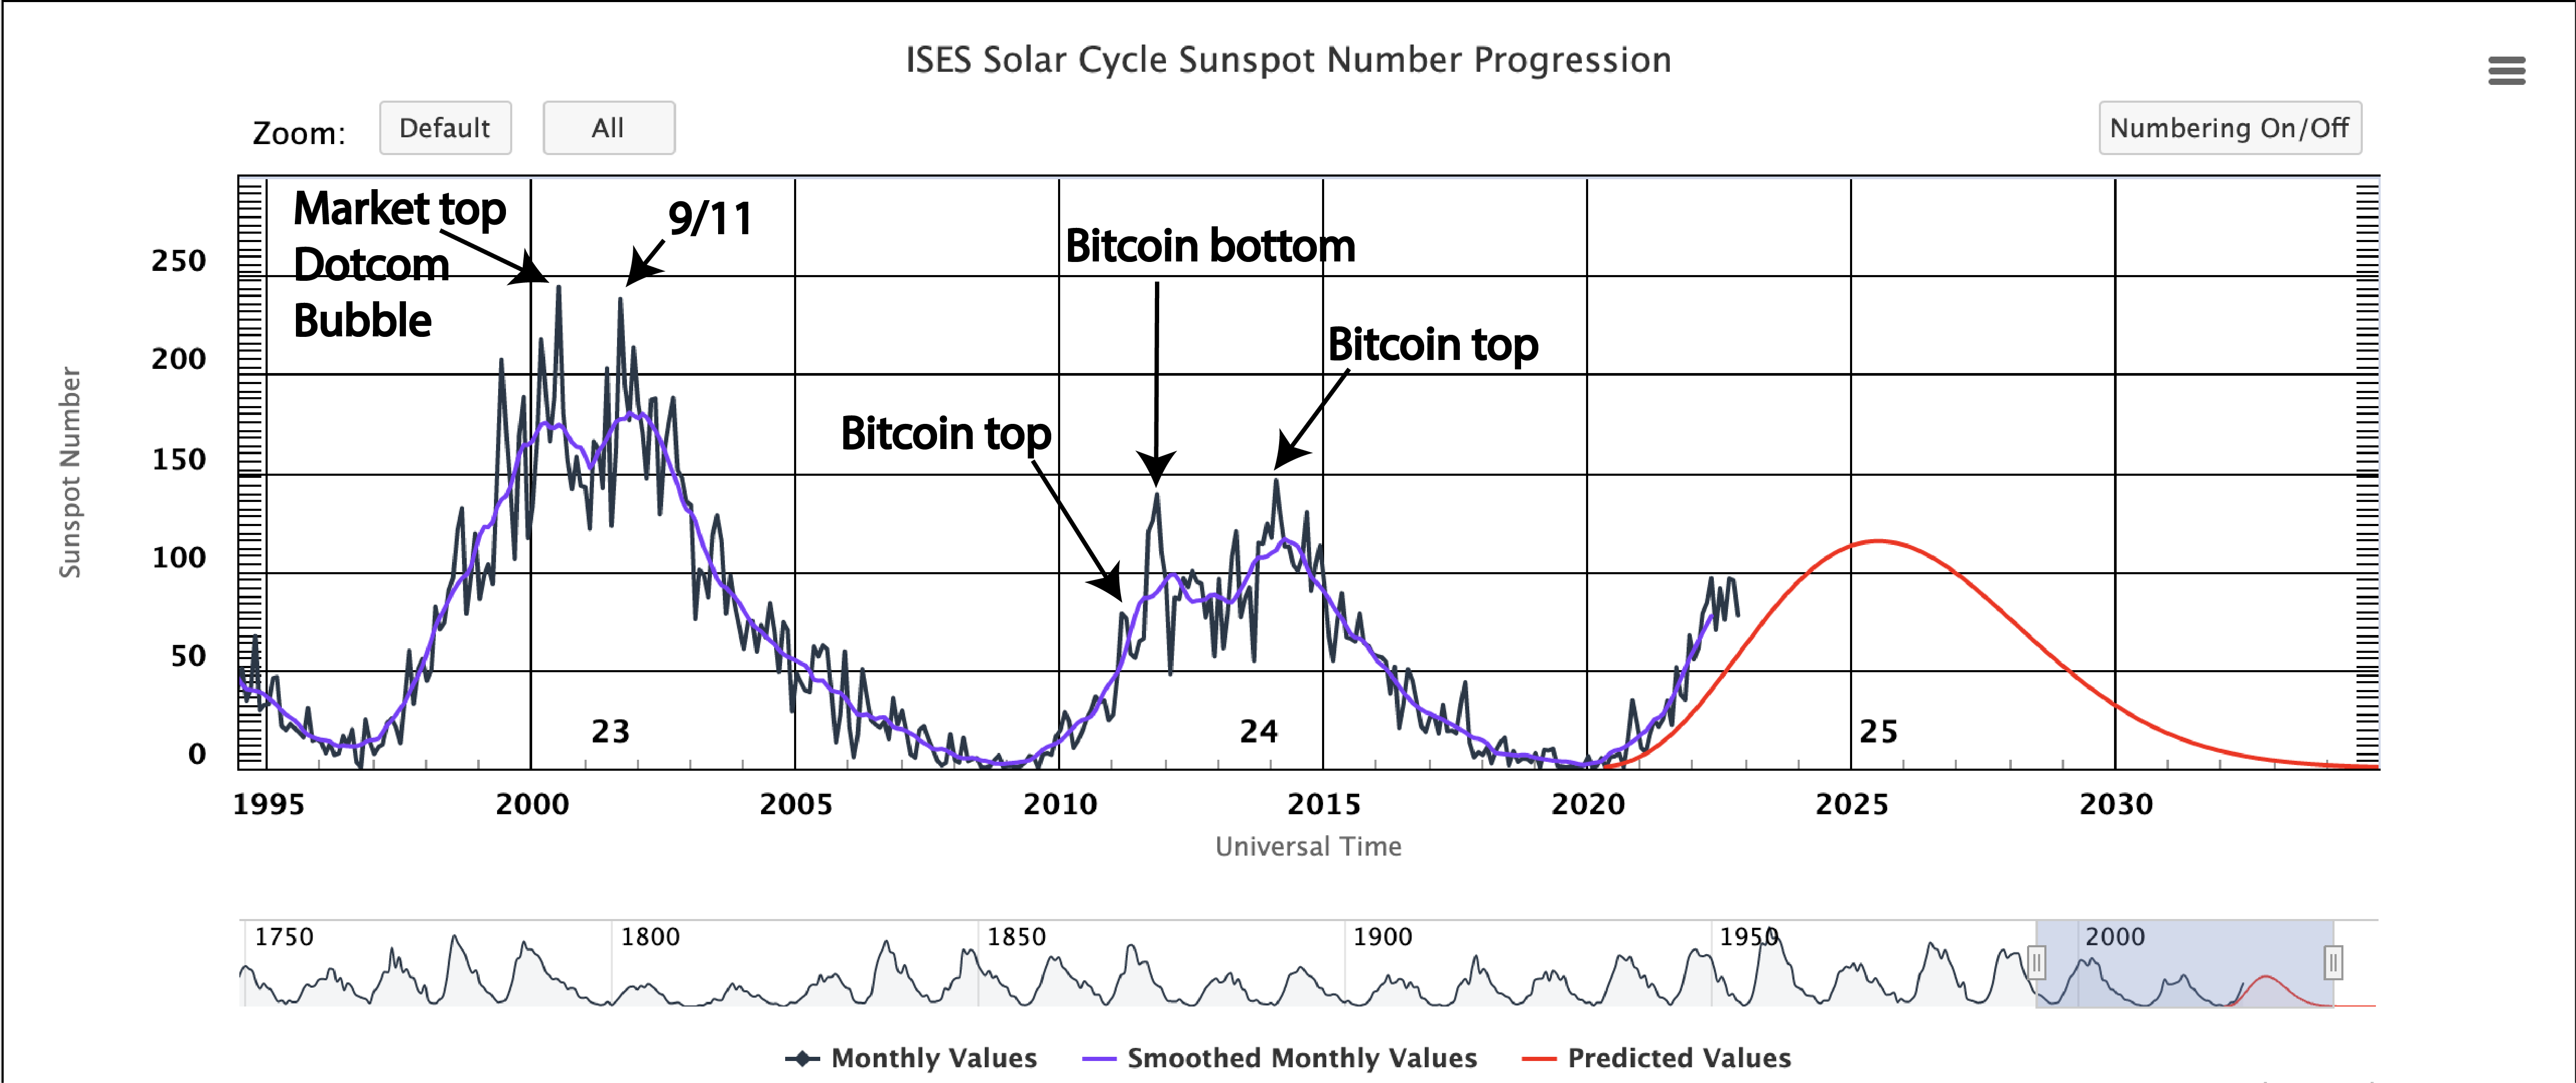
If we have a look at historical recessions and compare that to the sunspot cycle we can see that often when we see a recession, it goes along with a peak in the solar cycle. Although the chart below shows the period between 1926 - 2003, we can also see more recent market tops align with solar cycle peaks.
1.2 Sunspot Cycles and Recessions
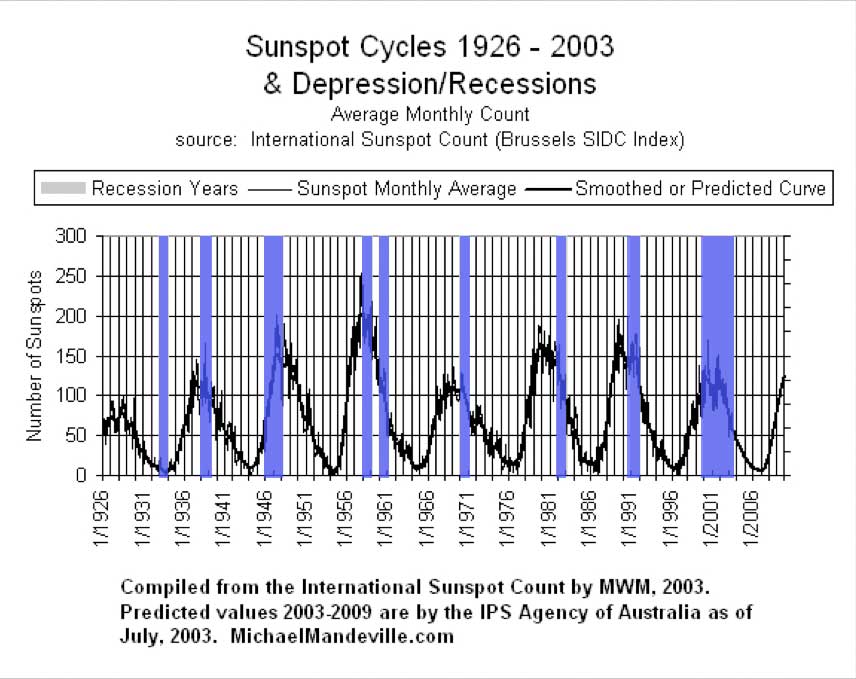
Solar cycle peaks also have been linked to the unemployment rate claimed by Mikhail Gorbanev.
 1.3 Solar cycles and unemployment rate
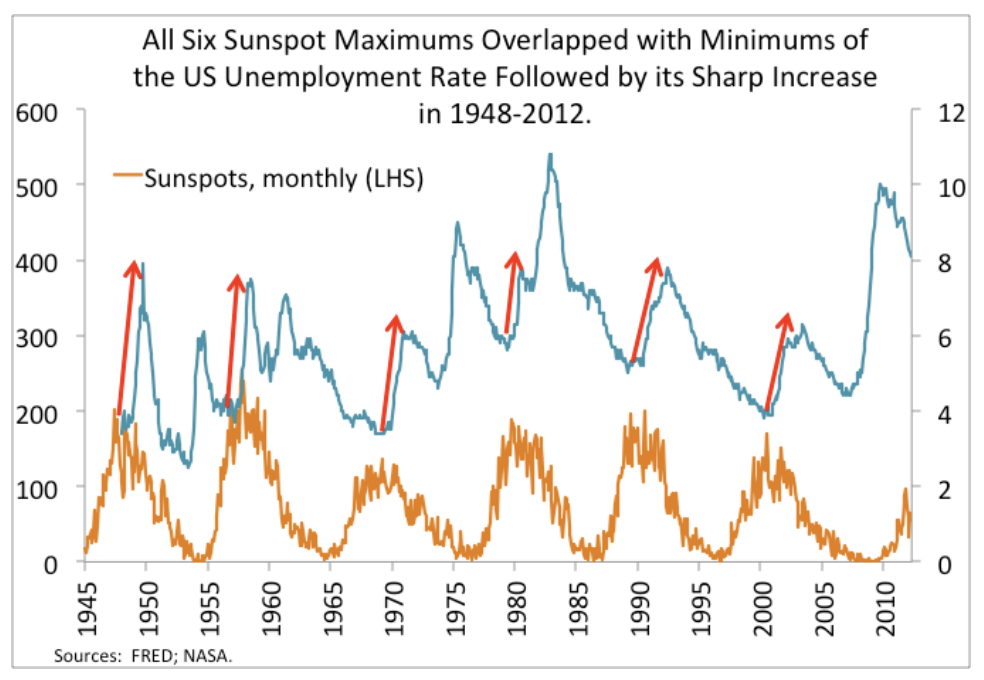
In the following image, you can see more recent events compared to the solar cycle. The DOTCOM bubble peak has a clear correlation with the solar cycle peak in the year 2000. In 2014 we can see a peak in solar activity as compared to the markets we do see a stagnation for a while. Note that the drop of 2007/2008, from the housing market bubble, came when solar activity was at the bottom of a cycle, however, we did see a peak in solar activity.
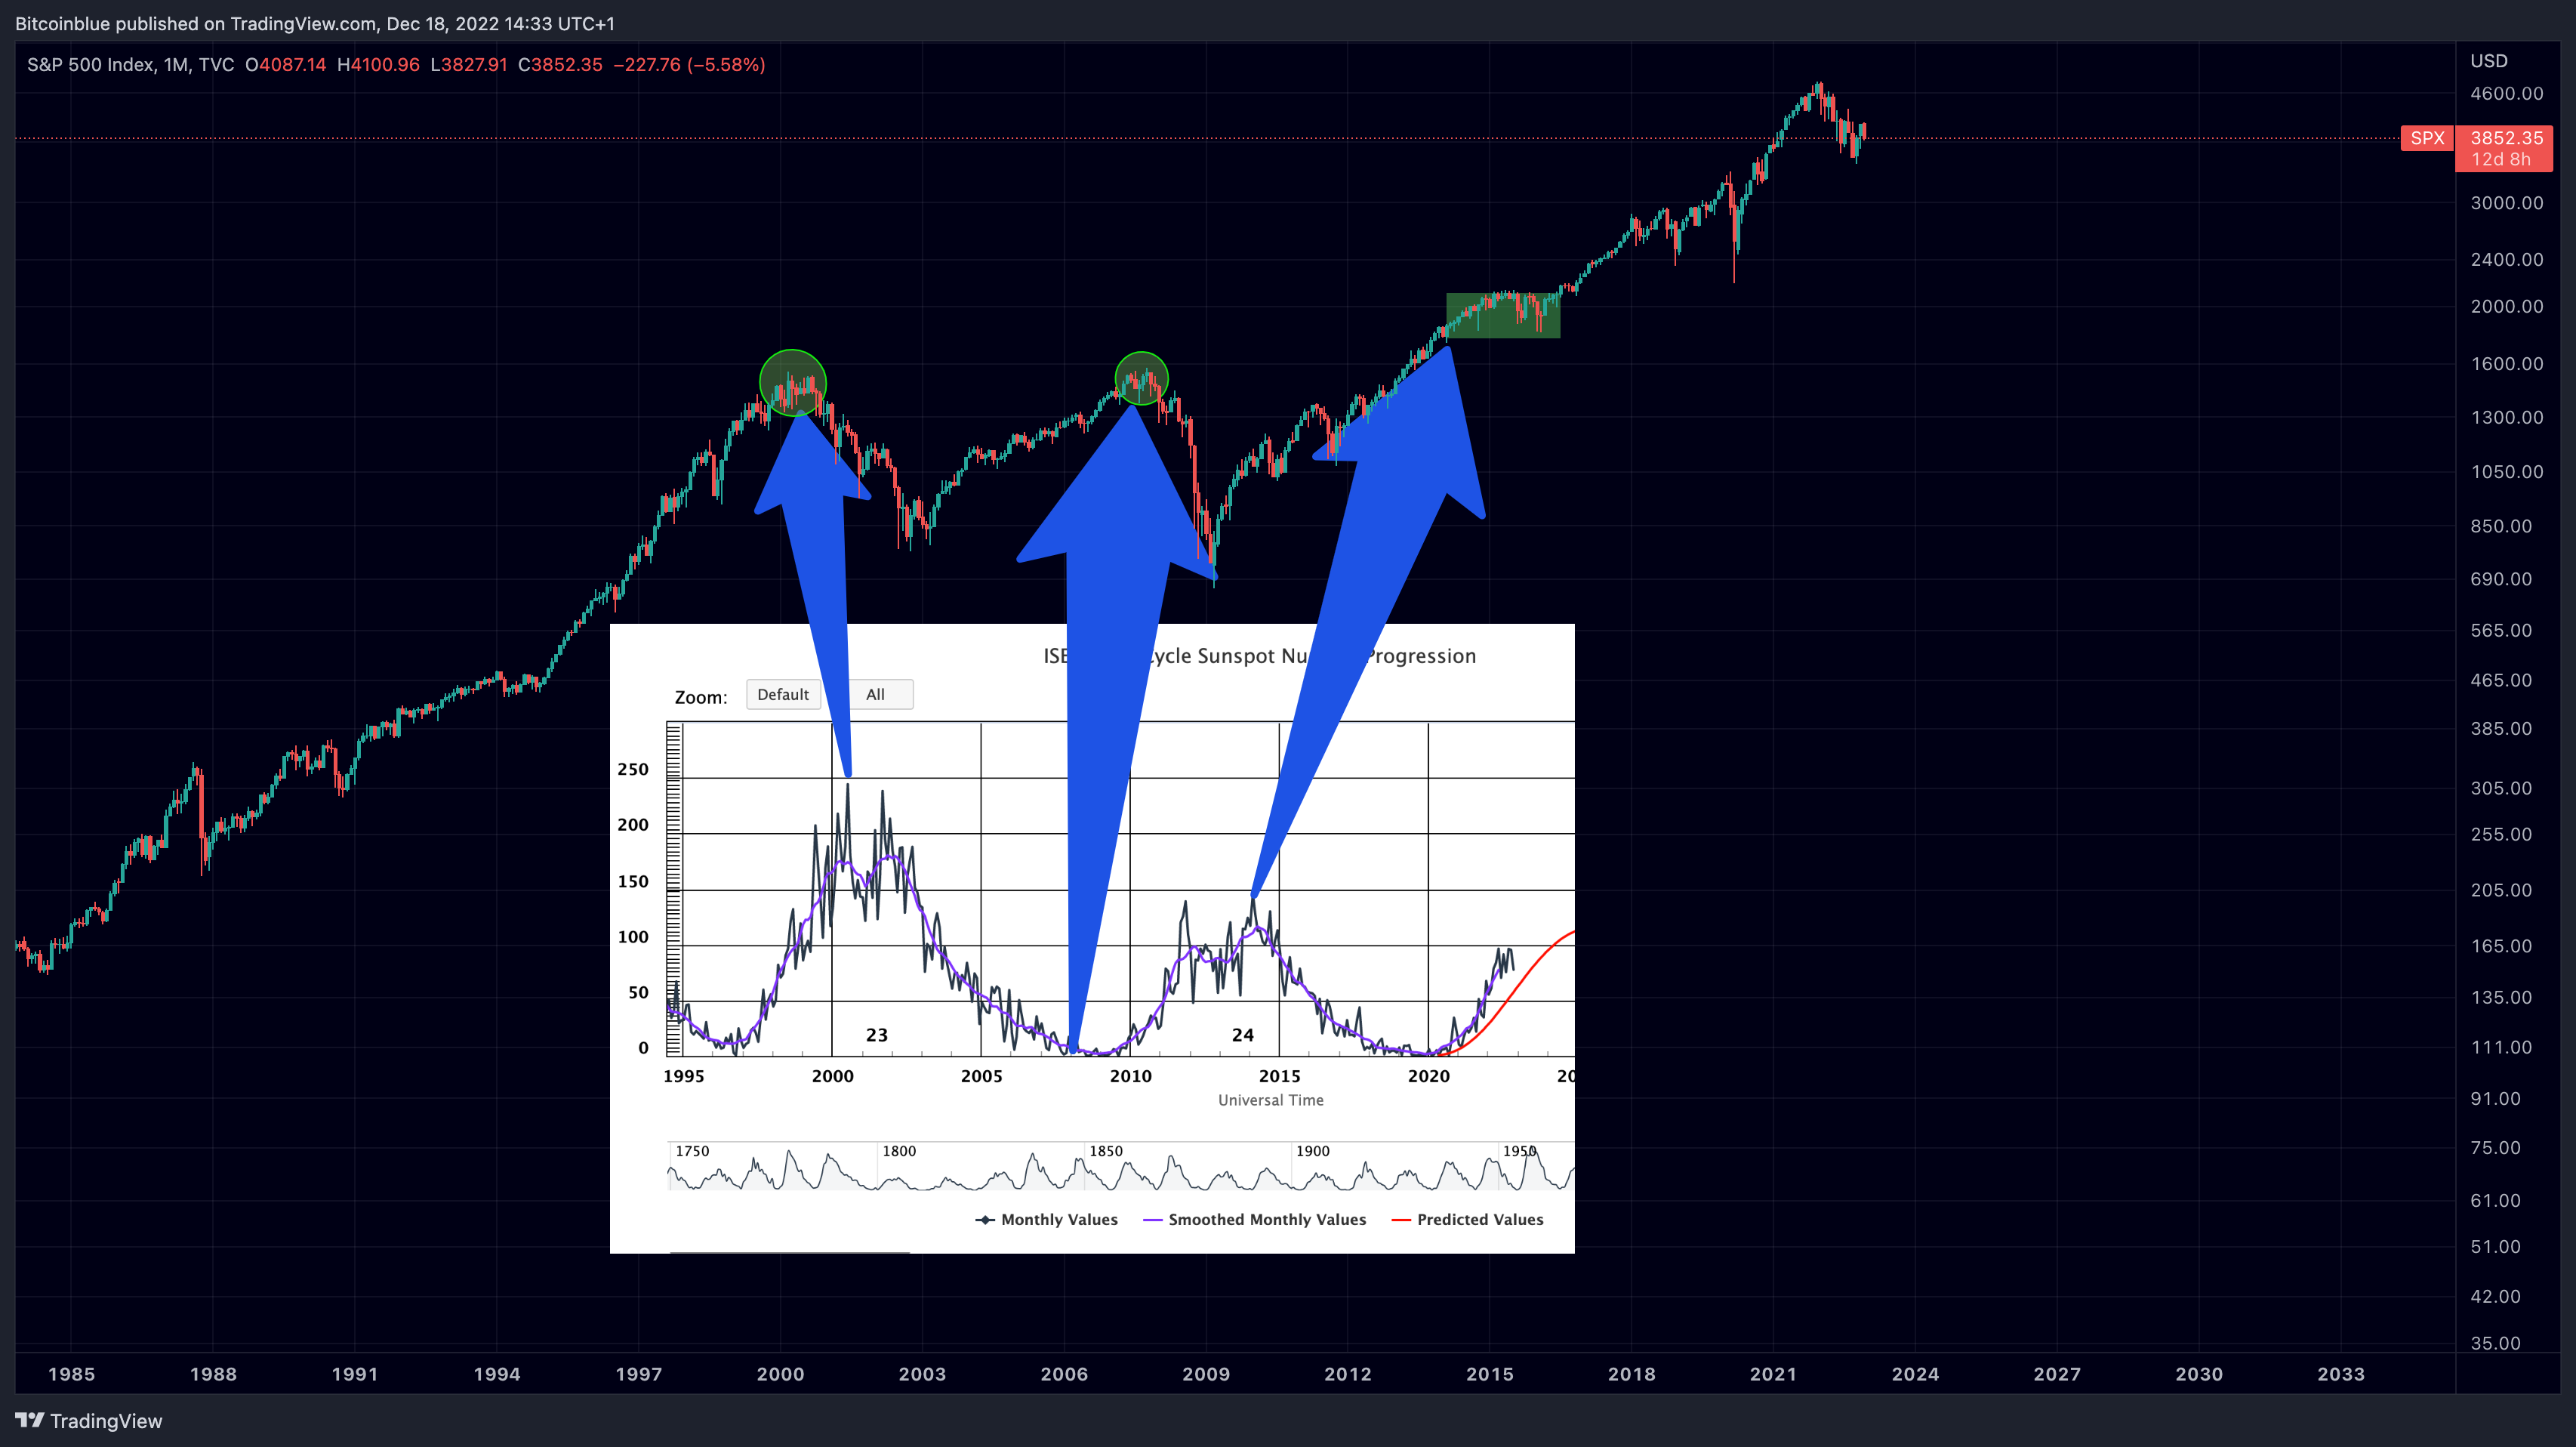 1.4 Recent Solar cycles in comparison with the SP500
Solar cycles and Bitcoin
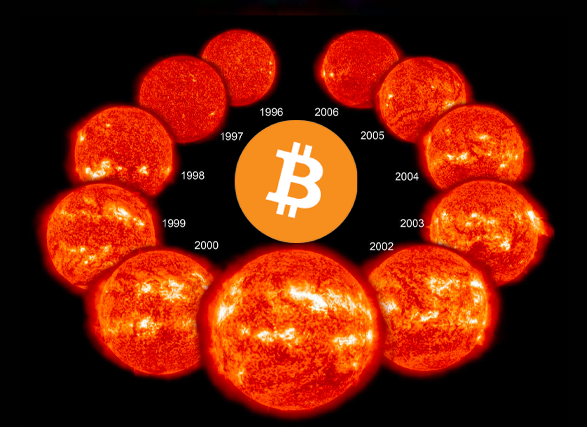
Although we can see a clear correlation between solar activity and the stock markets, we have less historical data to compare it with the Bitcoin price. It doesn’t come as a surprise that during the past years Bitcoin has been very tightly correlated to the SP500 as the markets were divided into “risk-on” or “risk-off” assets. Risk-on means, stock markets, and cryptocurrencies, and risk-off means mostly holding cash positions because of uncertainty. That means if we can predict what the SP500 is going to do, Bitcoin will most likely follow. Also, as illustrated in the first image of this article, peaks in solar activity do correspond with peaks and bottoms in the Bitcoin price. Let’s have a look at the predicted solar activity for the coming years.
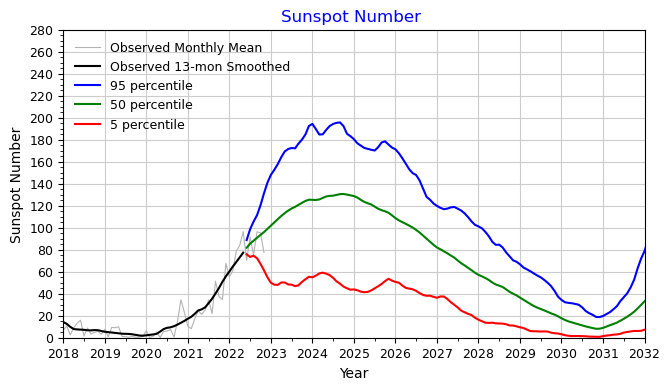 1.5 Predicted sunspot activity Source: NASA
This graphic shows different solar activity predictions. Note that the blue line peaks out around the end of 2023 into the beginning of 2024. The green line is slightly later and the red line suggests we’ve already peaked. This is a rough estimate and therefore important to continue and view the sunspot cycle to determine whether the solar activity has peaked or not, it is possible that in practice it might take longer for the solar activity to peak.
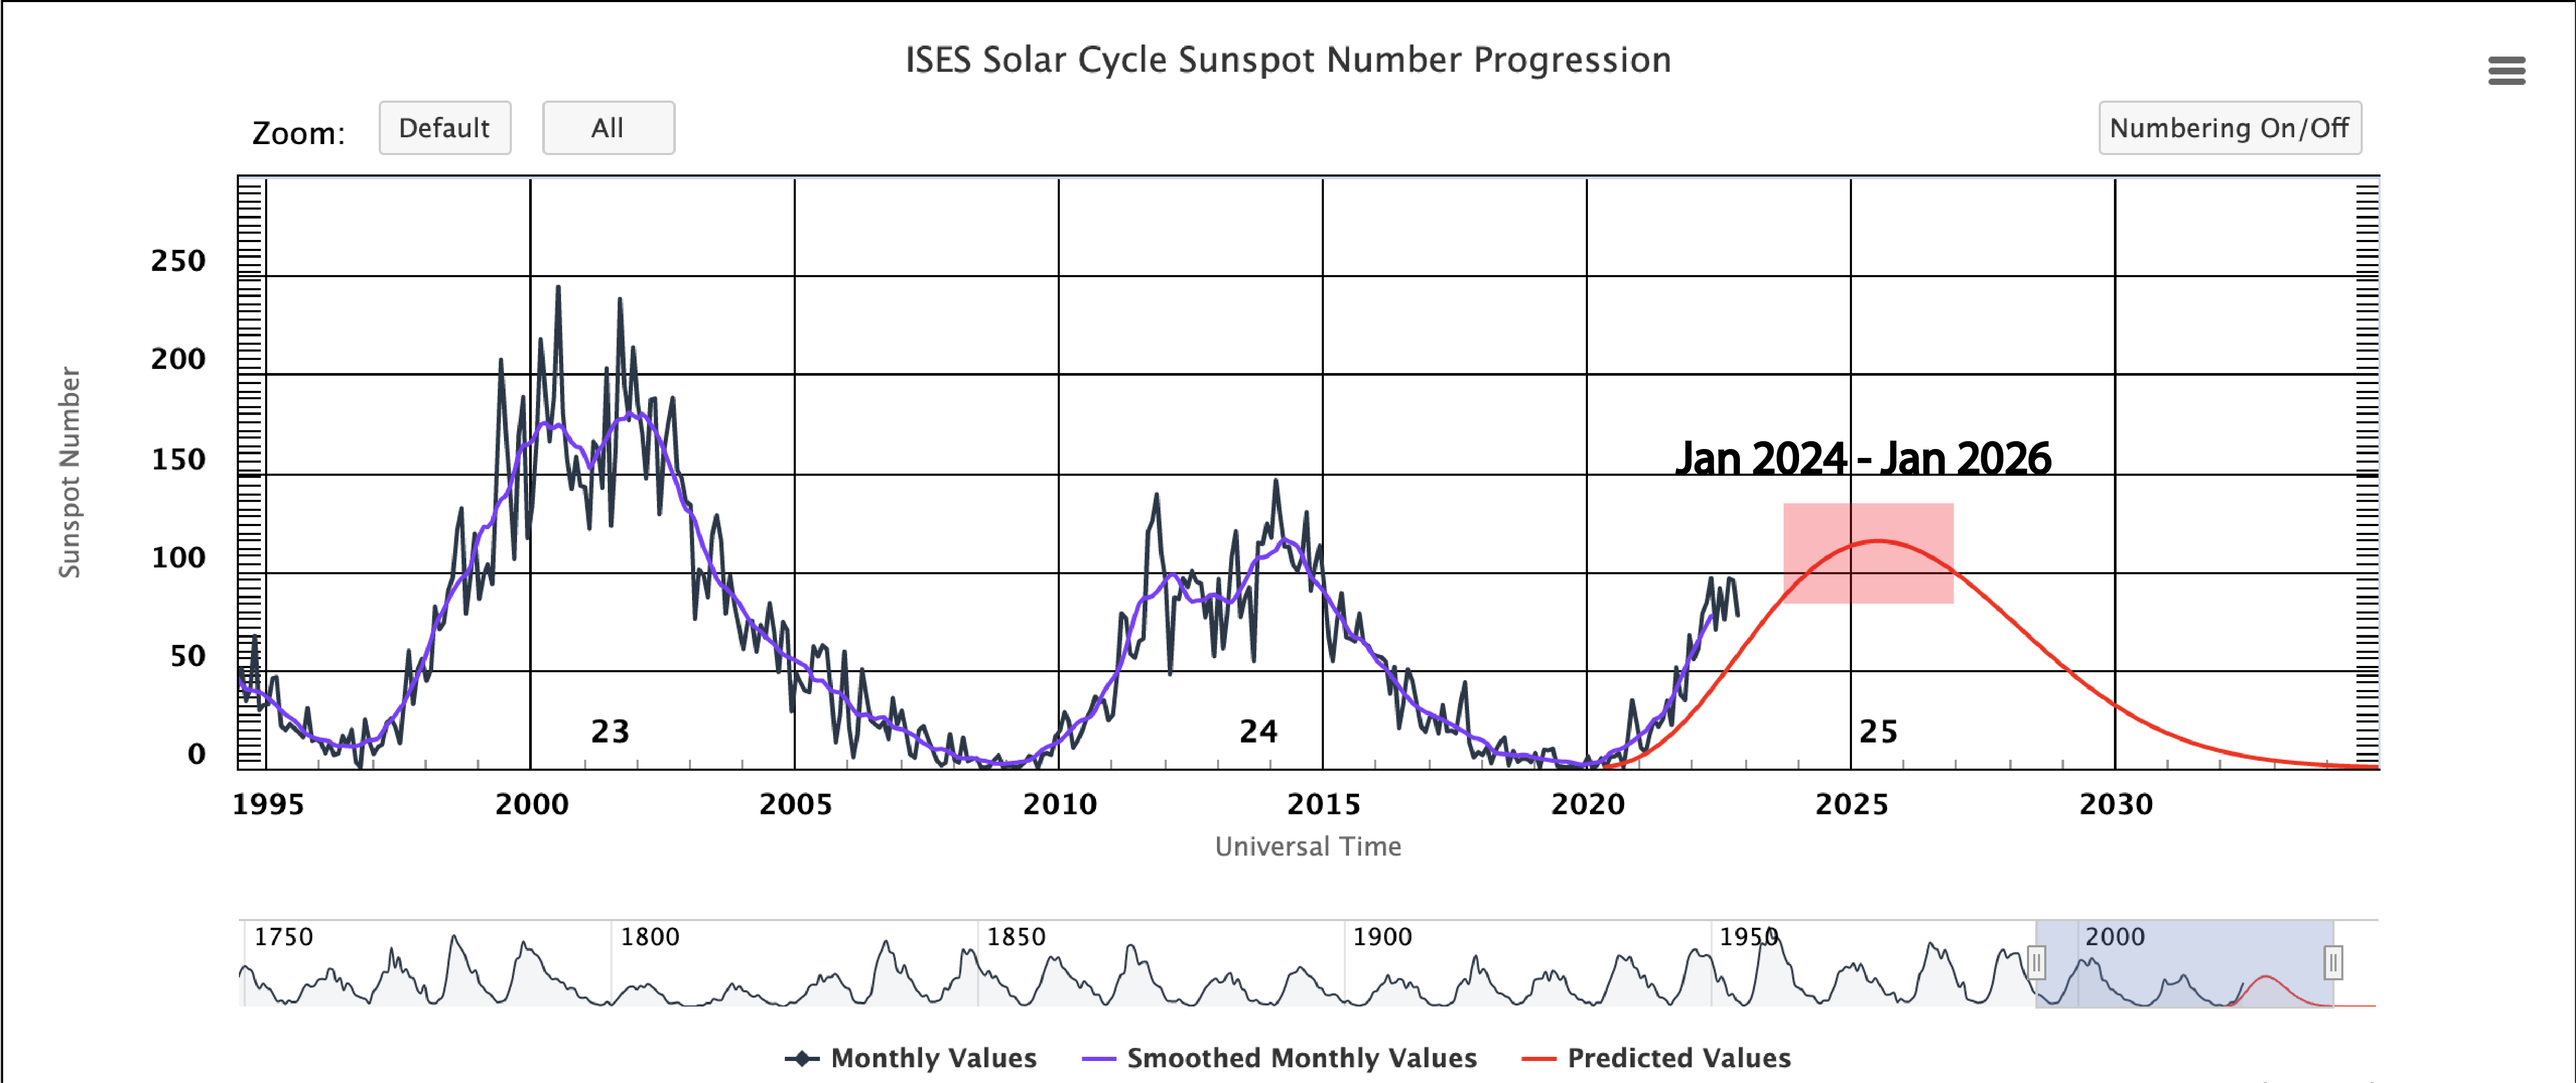
1.6 Solar activity prediction by NASA.
To make a very rough estimate, the solar activity in the current cycle will most likely peak between January 2024 to January 2026, with a slightly more likely peak earlier in the cycle (2024/2025). According to the correlation with the financial markets, this means that we will most likely see a mid/long-term top in the markets similar to the DOTCOM bubble top. This isn’t a certainty, but it is interesting to try and view the future market from a more astrological perspective. There is a famous saying made by JP Morgan which goes as follows:
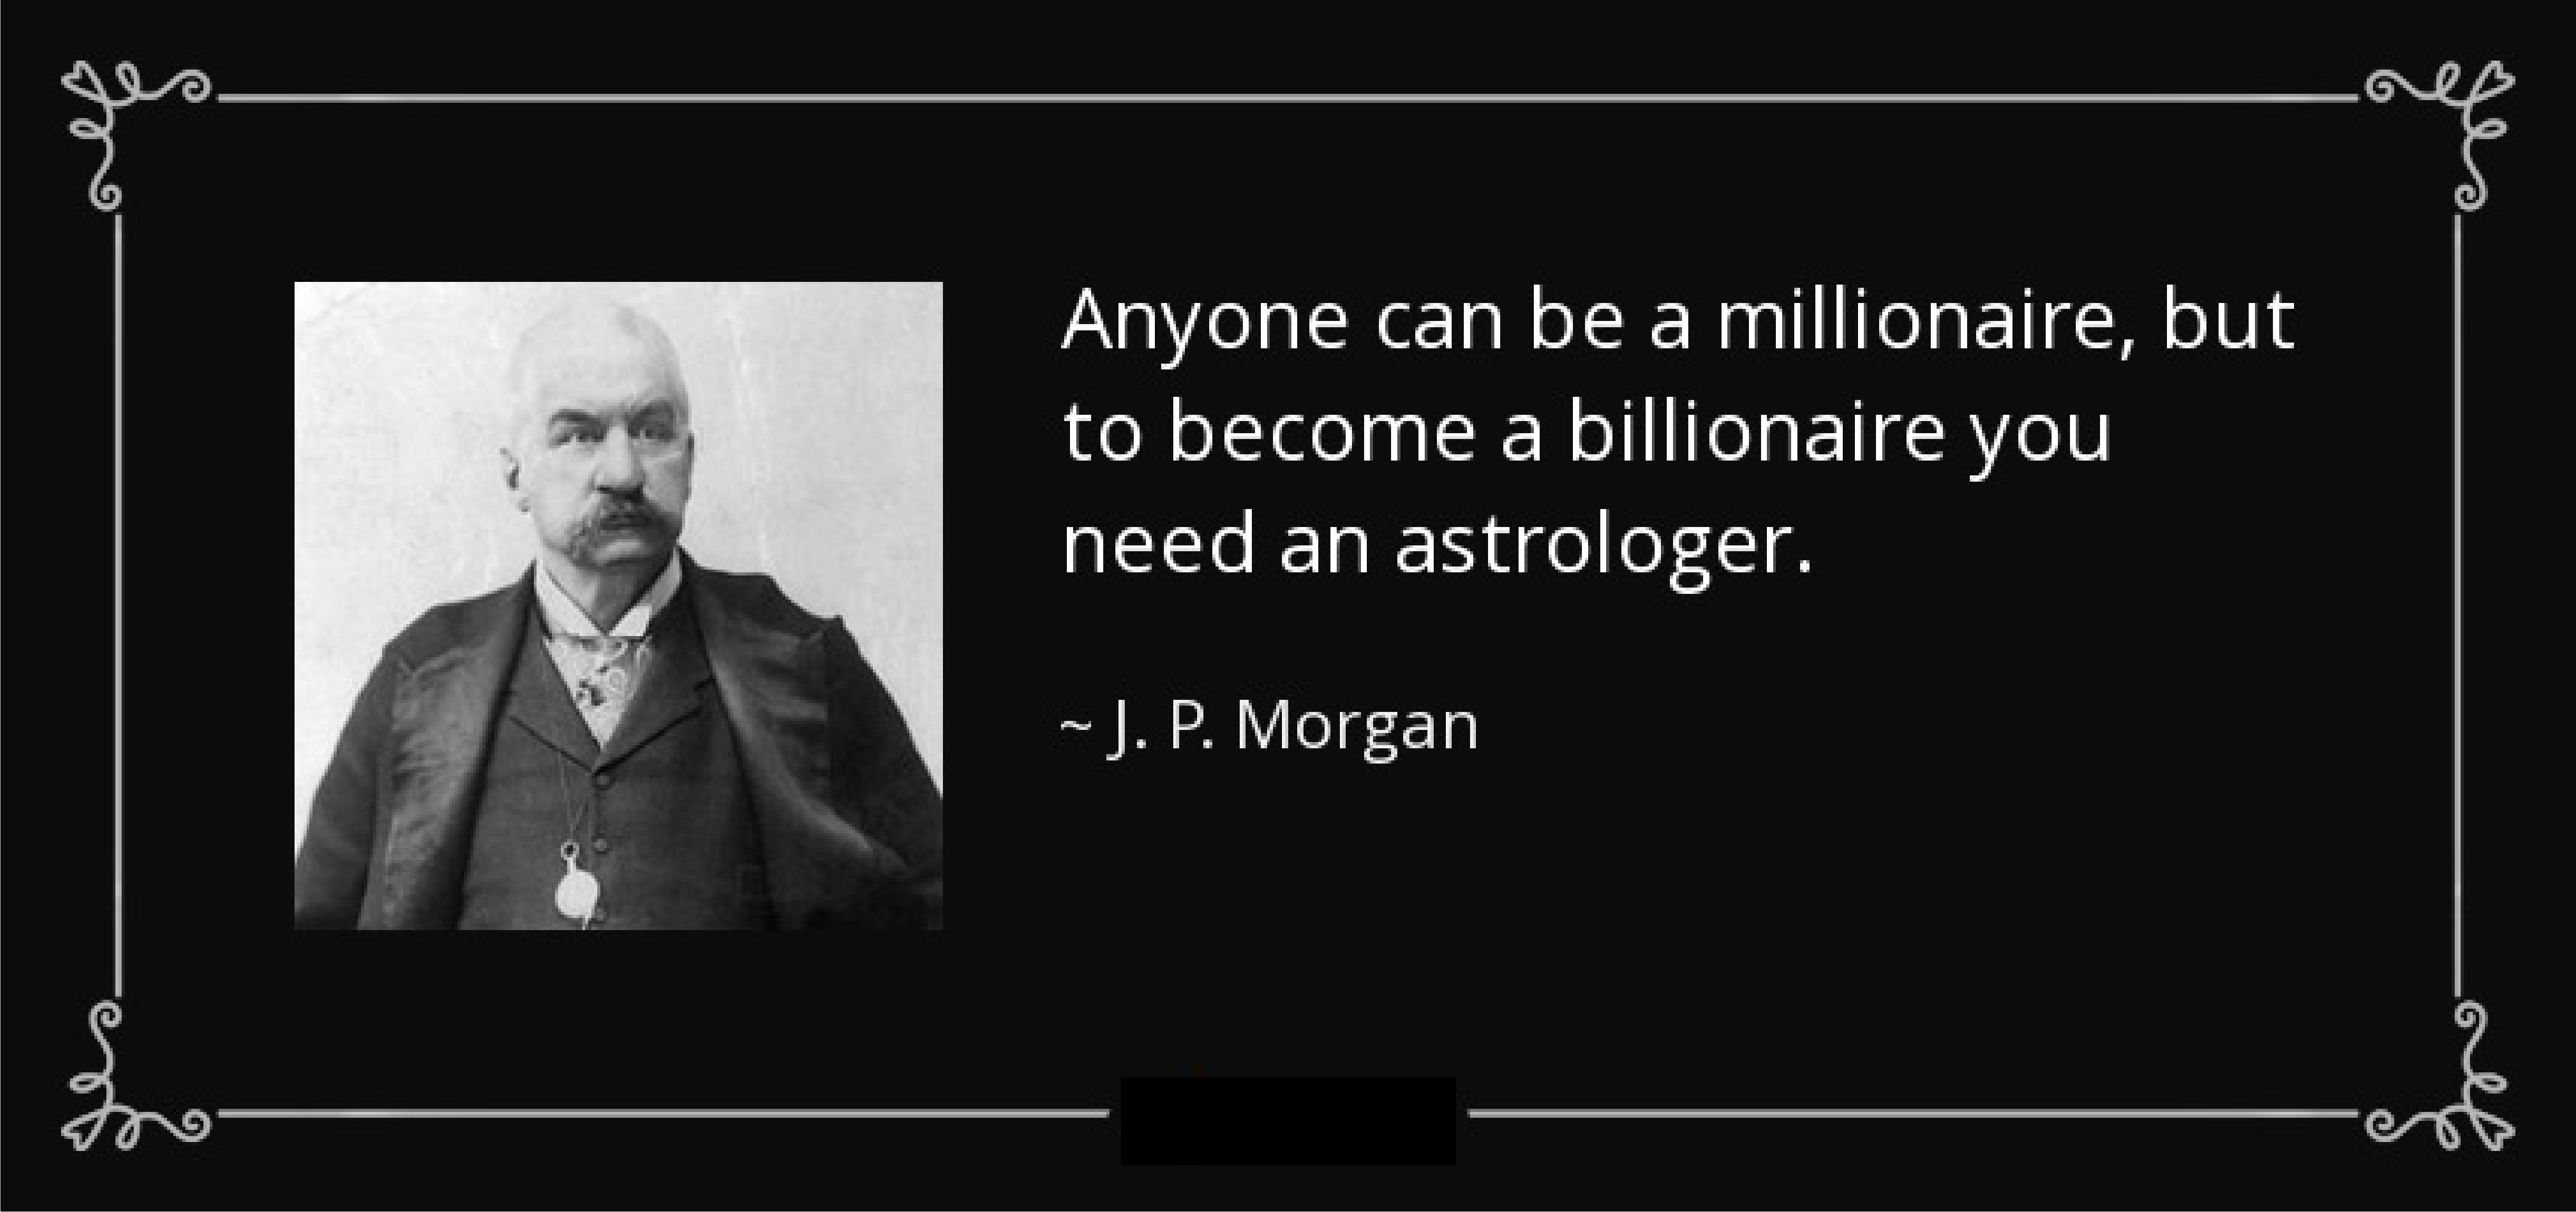 1.7 JP Morgen Quote
How to use the Sunspot Cycle for Bitcoin Price Prediction
There are two ways to use the sunspot cycle for Bitcoin price prediction.
The first way is to predict the SP500, and therefore predict the price of Bitcoin as the two are currently still highly correlated. It looks like concerning the sunspot cycle that the SP500 will print a macro top between January 2024 and January 2026. If this happens it will most likely create a top during similar periods with Bitcoin. It is important to track the correlation between the two markets carefully.
The 2nd way is to look at peaks in solar activity within the bigger cycle of 11 years. We’re seeing often that Bitcoin either peaks or bottoms when there is an increase in solar activity, a “spike”. And as you’ve seen earlier in this article, we do see some correlation between peaks in solar activity and Bitcoin tops/bottoms, however, this could also be because the regular financial markets are leading the market direction. The sunspot cycle interestingly enough also corresponds with the Bitcoin 16-year cycle.