Quantified Market Sentiment: How to Read the Emotions of the Crypto Crowd
Emotions play a critical role in both understanding the market and understanding yourself as a trader. It's no secret that the majority of market participants often find themselves on the wrong side of a trade. The ability to gauge what the crowd is feeling, and where they’re positioned can give you a powerful edge. But how can you actually measure market sentiment in a meaningful, data-driven way?
In this article, we’ll explore the key tools and metrics that help quantify market sentiment from fear indexes to funding rates and heatmaps, and how to use them to trade Crypto.
Turning Emotion and Sentiment into Data
While emotions might seem intangible, there are several reliable ways to quantify market sentiment using data. Tools like the Crypto Fear and Greed Index offer a broad overview by analyzing factors such as volume and volatility. You can also dive into funding rates, which reflect whether the majority of traders are positioned long or short, an essential sentiment signal in perpetual futures markets.
Another useful metric is the premium index, which compares prices between spot and futures markets. When futures are trading at a significant premium, it often indicates heightened speculation and bullish sentiment. Beyond on-chain and market data, social media sentiment analysis can also offer insights into the mood of the crowd, especially during high-volatility events.
Crypto Fear and Greed Index
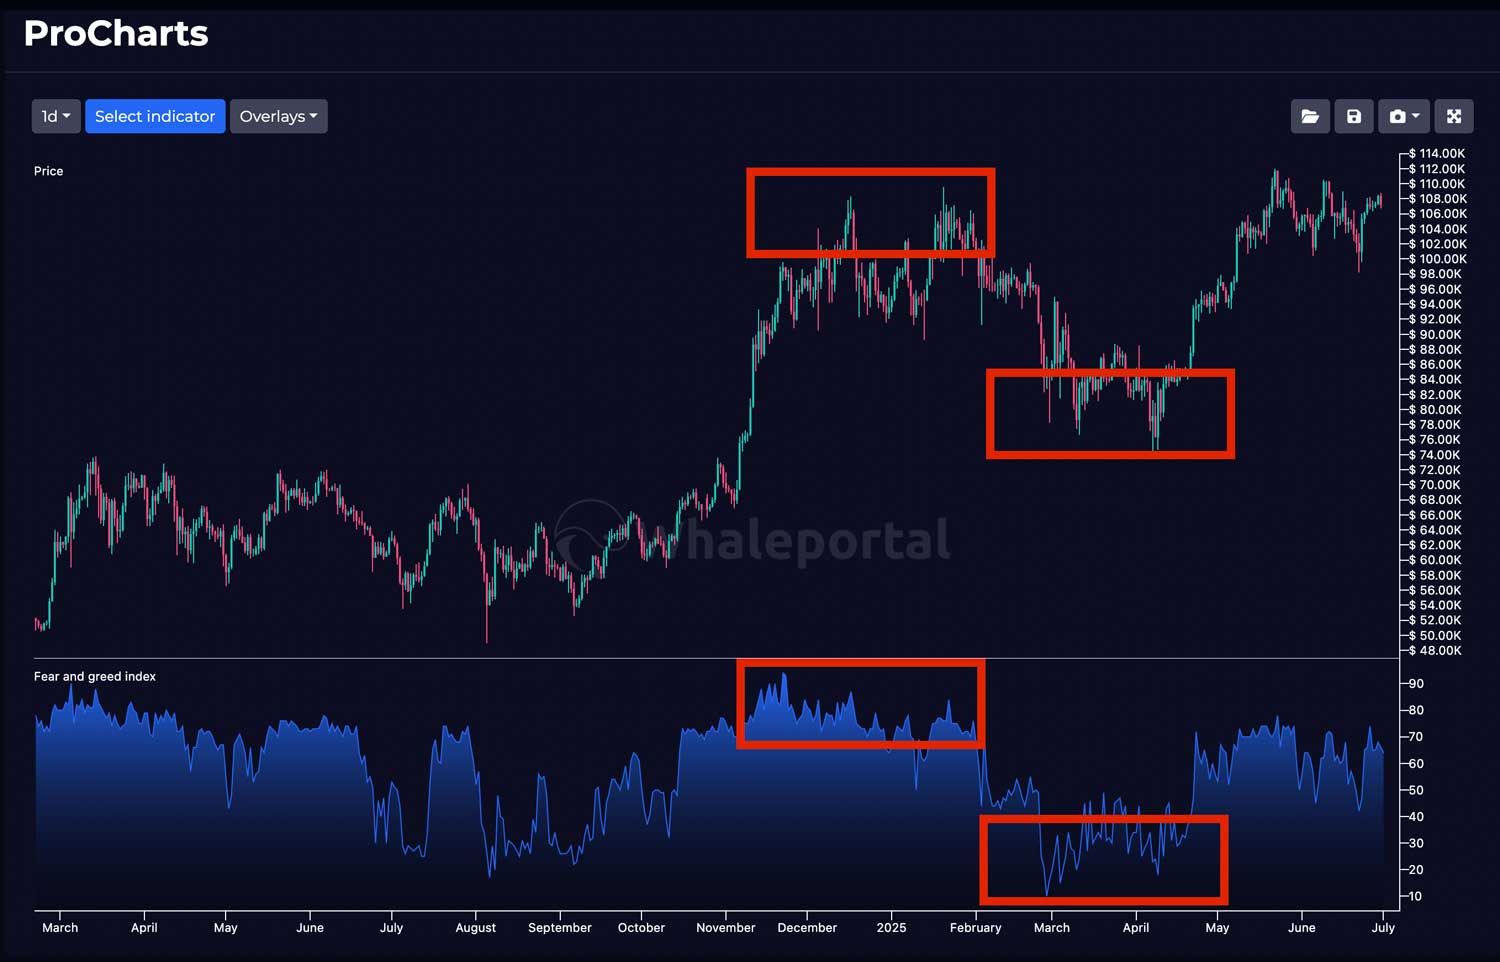
The Crypto Fear and Greed Index measures overall market sentiment by combining several key data points, including trading volume, price volatility, Bitcoin dominance, and social media trends. It provides a broad view of how investors are feeling, helping traders identify whether fear or greed is currently driving the market.
This index is best used as a mid- to long-term sentiment indicator. As shown in the image below, when the index reaches levels of extreme greed, it often suggests that Bitcoin may be approaching a local top. On the other hand, extreme fear can signal widespread capitulation and may indicate that the market is forming a bottom with potential for a rebound.
Track the live Crypto Fear and Greed Index anytime on Whaleportal PRO, even with a free account.
Key Sentiment Metrics Explained
Funding Rates
Funding rates are one of the best ways to see where most traders are placing their bets. When funding rates are positive, it means most traders are going long. When they’re negative, it means more traders are going short.
It’s also important to look at how high or low the funding rate is. For example, if funding is very high, it usually means too many traders are going long, which can lead to a quick drop in price when those positions get liquidated.
You shouldn’t rely on funding rates alone, but when combined with other indicators, they give you a clear view of what the crowd is doing.
Premium Index
The premium index shows where most of the activity is happening in the market. When the index is positive, it means futures prices are higher than spot prices, which suggests that more trading is happening in the futures market. When the index is negative, it means spot prices are higher, so there’s more activity on the spot market.
This helps you understand whether the market is driven more by speculation or by accumulation. A strong futures premium usually signals optimism, sometimes even euphoria, while more activity on the spot market often points to steady accumulation, which can be a healthier sign for the market.
Open Interest
Open interest shows how much money is currently tied up in open positions, and it adds important context to funding rates and the premium index. While funding and premium data help you see where the speculation is happening and on which side (long or short), open interest tells you how strong that speculation is.
The higher the open interest, the more pressure is behind those positions. So, for example, if funding rates are high and open interest is also high, it means a large amount of money is betting long, making a potential liquidation or correction more impactful. In that sense, open interest helps you judge how serious the positioning is.
Whaleportal Sentiment Heatmaps (short-term sentiment)
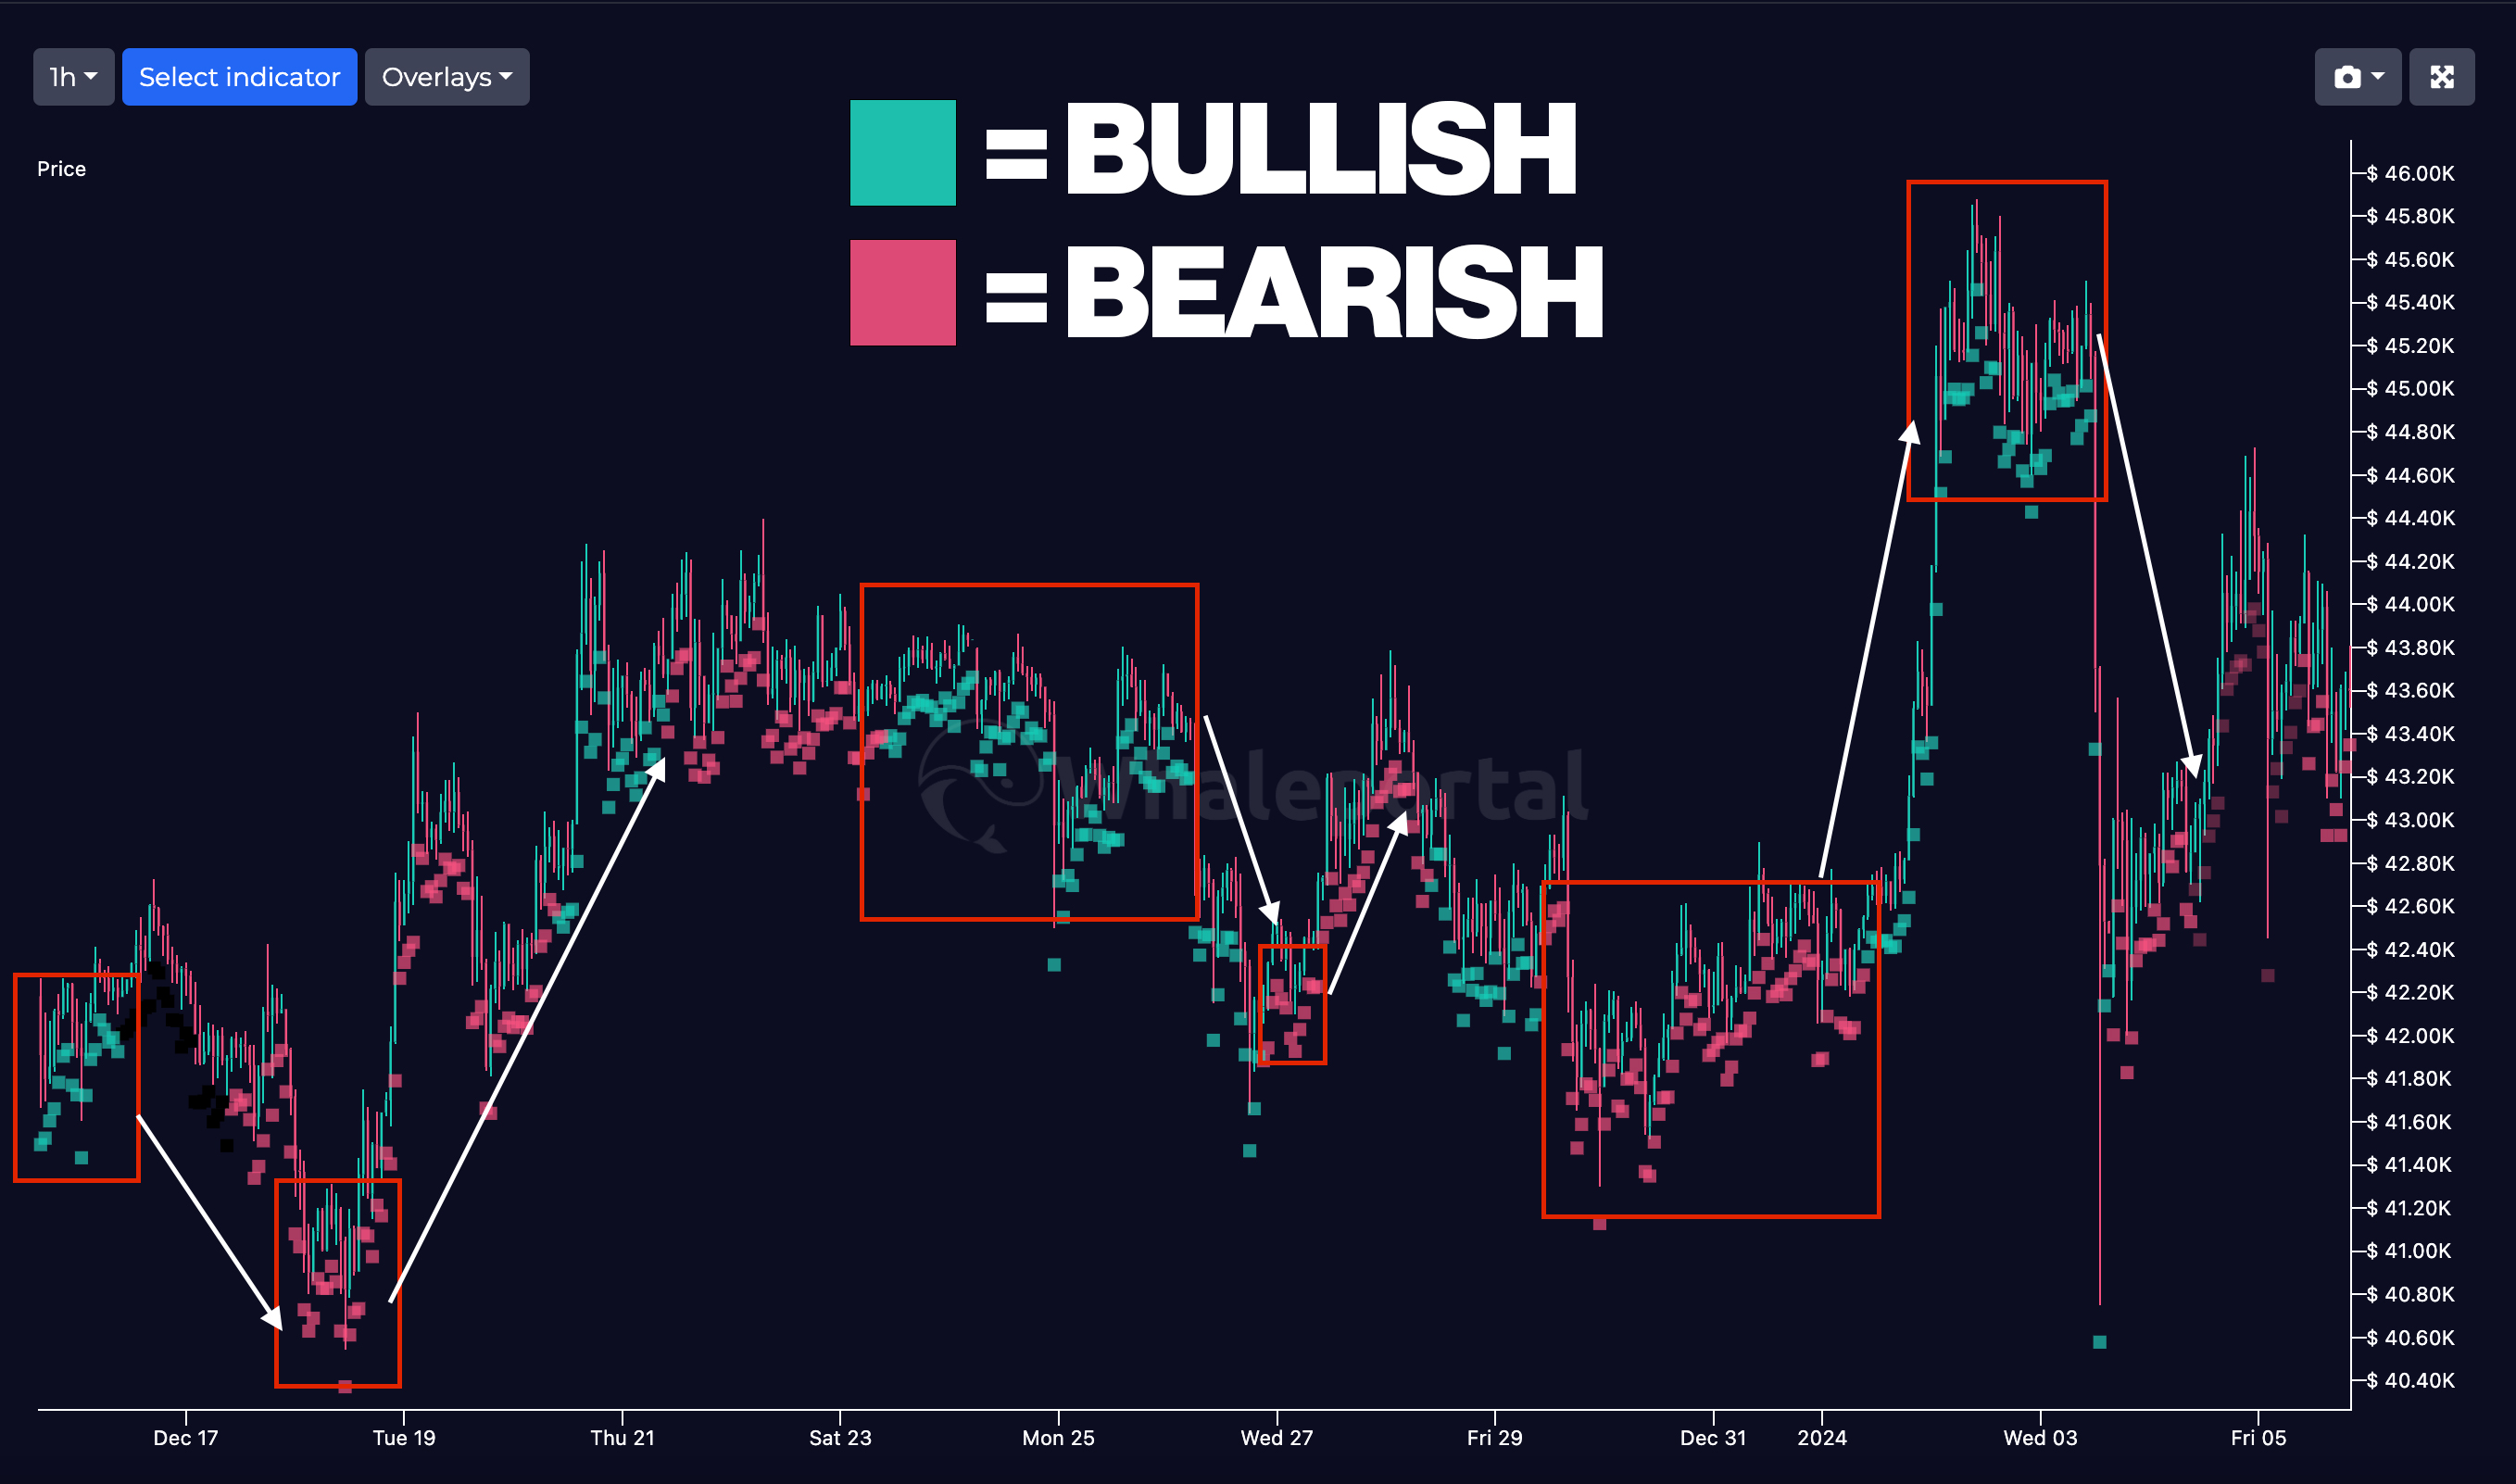
At Whaleportal, we track daily sentiment on social media to capture short-term market mood, something especially useful for futures traders. This is the only sentiment metric on the platform that updates daily and is focused on short-term outlooks.
The data is gathered by scanning content shared by top crypto influencers and analyzing whether their messages lean bullish or bearish. The result is shown using five sentiment levels:
- Extremely Bearish
- Bearish
- Neutral
- Bullish
- Extremely Bullish
This short-term sentiment indicator has proven valuable in the past, but like all tools, it works best when combined with other data points. For example, while the Crypto Fear and Greed Index is useful for long-term investors or swing traders, it’s less effective for short-term decisions.
For traders focused on shorter timeframes, metrics like funding rates, the premium index, and open interest are much more actionable. When these are combined with tools like the Whaleportal sentiment heatmap, they can give a powerful edge in spotting where the crowd is positioned and when a reversal may be near.
Sentiment Indicators Comparison Table
Here is an overview of how and when to use these indicators.
|
Tool/Metric |
Best For |
Timeframe |
Signal Type |
|
Fear and Greed Index |
Macro Tops/Bottoms |
Mid/Long-term |
Emotional Extremes |
|
Funding Rates |
Insights in Positions |
Short-term |
Long/Short Bias |
|
Premium Index |
Spot vs. Futures data |
Short/Mid-term |
Accumulation/Speculation |
|
Open Interest |
Position Strength |
Short/Mid-term |
Leverage Pressure |
|
Sentiment Heatmaps |
Daily Market Mood |
Short-term |
Influencer Tone |
How to Combine Indicators
Instead of using one tool in isolation, the real edge comes from combining multiple sentiment signals.
So let’s go over a couple of examples, how the indicators can complement each other.
- High open interest + high funding = risky long crowd
When funding rates are high, it indicates that the majority of traders are going long on the asset. If open interest is also high, it means there’s a large amount of capital behind those positions, which makes the funding signal more meaningful. In other words, the two metrics complement each other.
On the other hand, if open interest is low, a high funding rate still tells you that most traders are long, but it also suggests that the total number of participants (or the size of their positions) is relatively small. This makes the signal weaker and less likely to trigger a major market reaction.
- Extreme fear + low OI = possible bottom forming
When there is extreme fear in the market, shown by tools like the Fear and Greed Index and Whaleportal’s sentiment heatmaps, combined with very low open interest, it often means most traders have exited their positions. This type of environment can signal that a market bottom is starting to form.
This is a good example of how different sentiment signals can work together. If the premium index is also negative, it shows that more trading activity is happening on the spot market, which often points to quiet accumulation rather than speculation. This adds further confirmation that optimism is lacking, an important condition before a possible reversal.
At that stage, it’s a good time to go to the charts, analyse the structure, and look for entry opportunities.
Sector Strength Indexes (Meme Season Index and more)
Analyzing market sentiment helps you understand what traders and investors are feeling. It adds an emotional layer to your analysis, an extra dimension that goes beyond price action alone. But understanding sentiment is just one part of the picture. It's also important to track where capital is flowing in the market."
This is where tools like the Meme Season Index, along with other sector indexes such as Gaming, ISO 20022, and DeFi, become valuable. These indexes monitor the top tokens within each category and calculate relative strength. When a group of tokens, like meme coins, starts showing strong performance as a cluster, it’s a sign that hype and momentum are shifting into that sector. Traders and investors can use this information to spot opportunities and align with emerging trends.
Final Thoughts
Understanding the emotional state of the market can give you a real edge, especially when that emotion is backed by data. By using tools like the Fear and Greed Index, funding rates, the premium index, open interest, and sentiment heatmaps, you can begin to see what most traders overlook, how the crowd is feeling, and where pressure is building, but it also gives insight into your own emotional state. You can compare how you feel with how the majority feels in the market; this lets you know whether you’re trapped in the emotional state of the markets.
At Whaleportal, many of these tools are free to access. Our platform offers real-time funding data, premium index data, sector strength indexes, and visual sentiment heatmaps that help you understand market psychology.
Frequently Asked Questions (FAQ)
What is market sentiment in crypto trading?
Market sentiment refers to the overall mood or emotional tone of crypto traders and investors. It reflects whether people are feeling optimistic (greedy) or pessimistic (fearful) about price direction. Understanding sentiment helps you anticipate potential tops, bottoms, or trend shifts.
How can I measure crypto market sentiment?
You can measure sentiment using a combination of tools and data points, such as:
- The Crypto Fear and Greed Index
- Funding rates on perpetual futures
- Premium index (spot vs futures pricing)
- Open interest on exchanges
- Social media sentiment and influencer behavior
Whaleportal combines several of these metrics into visual, real-time dashboards.
What is the difference between long-term and short-term sentiment?
Long-term sentiment (e.g., Fear and Greed Index) is better for identifying macro trends, tops, or bottoms.
Short-term sentiment (e.g., daily influencer sentiment or liquidation heatmaps) is more useful for traders looking to catch quick reversals, traps, or momentum shifts.
How do funding rates reflect trader sentiment?
When funding rates are positive, more traders are going long.
When funding rates are negative, more traders are short.
Extremely high or low funding rates can signal overcrowded trades and possible reversals.
What is Whaleportal, and how can it help me?
Whaleportal is a free crypto analytics platform that offers real-time charts and sentiment tools like:
- Funding and premium indexes
- Fear and Greed Index
- Meme Season Index
- Sector strength dashboards
Most tools are available without signing up, and they're designed to help traders see what the crowd is doing before the crowd knows it.
Is Whaleportal free?
Yes. Most tools on Whaleportal, including sector strength indexes, premium index, funding rates, and open interest, are completely free to use. You just have to create an account. Sentiment heatmaps do require a PRO account.
Related Articles
- Apex Omni vs. dYdX Exchange: Which Decentralised Exchange is Better?
- Best Crypto Deposit Bonuses of 2025
- Best Crypto Exchanges for Passive Income