The Benner cycle, Sunspot Cycles and Recessions
Everything in the universe moves in cycles like day and night, winter and summer. The cyclical nature of our world extends beyond nature itself, shaping financial markets as well. Just like the seasons, markets rise and fall in repeating patterns. In this article, we'll explore the similarities between the Benner Cycle and Sunspot Cycles to determine whether they can help us predict the next recession.
The Benner Cycle
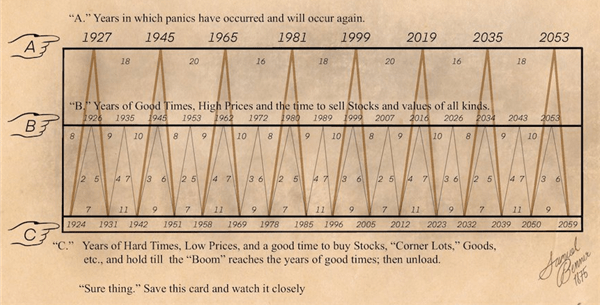
The Benner Cycle is a long-term economic cycle proposed by Samuel Benner in 1875. It predicts recurring boom and bust cycles in the economy, particularly focusing on agriculture, stock markets, and recessions. Benner believed that economic cycles were influenced by natural rhythms rather than random events, aligning with sunspot activity and market psychology. Some analysts still use his cycle to forecast economic recessions and market corrections.
The Benner Cycle is a pattern of booms and busts in the economy. It divides time into good times (growth, strong markets) and hard times (recessions, crashes).
- Booms happen every 10-11 years with high prices and strong markets.
- Busts come every 8 years, bringing slowdowns.
- Big crashes or recessions occur about every 16-18 years.
Benner Cycles Historic Performance
Samuel Benner’s cycle successfully predicted major market events, including booms, busts, and recessions:
- 1929 Stock market crash and Great Depression.
- 1931 Major economic downturn, aligning with Benner’s recession cycle.
- 1981 Market peak, followed by a slowdown.
- 1999 Market top (DOTCOM top)
- 2008 Global financial crisis, matching his 16-18 year recession pattern.
- 2013 Bullish year, as predicted by Benner’s cycle.
These are some examples, showing the significance of the Banner cycle with the ebb and flows of the stock market. But let’s have a look at one particular example in specific and that is the DOTCOM bubble and the big recession that came afterwards. We will have a look at the S&P500 divide by the M2 Money Supply, this gives a representation of the purchasing power of the S&P500.
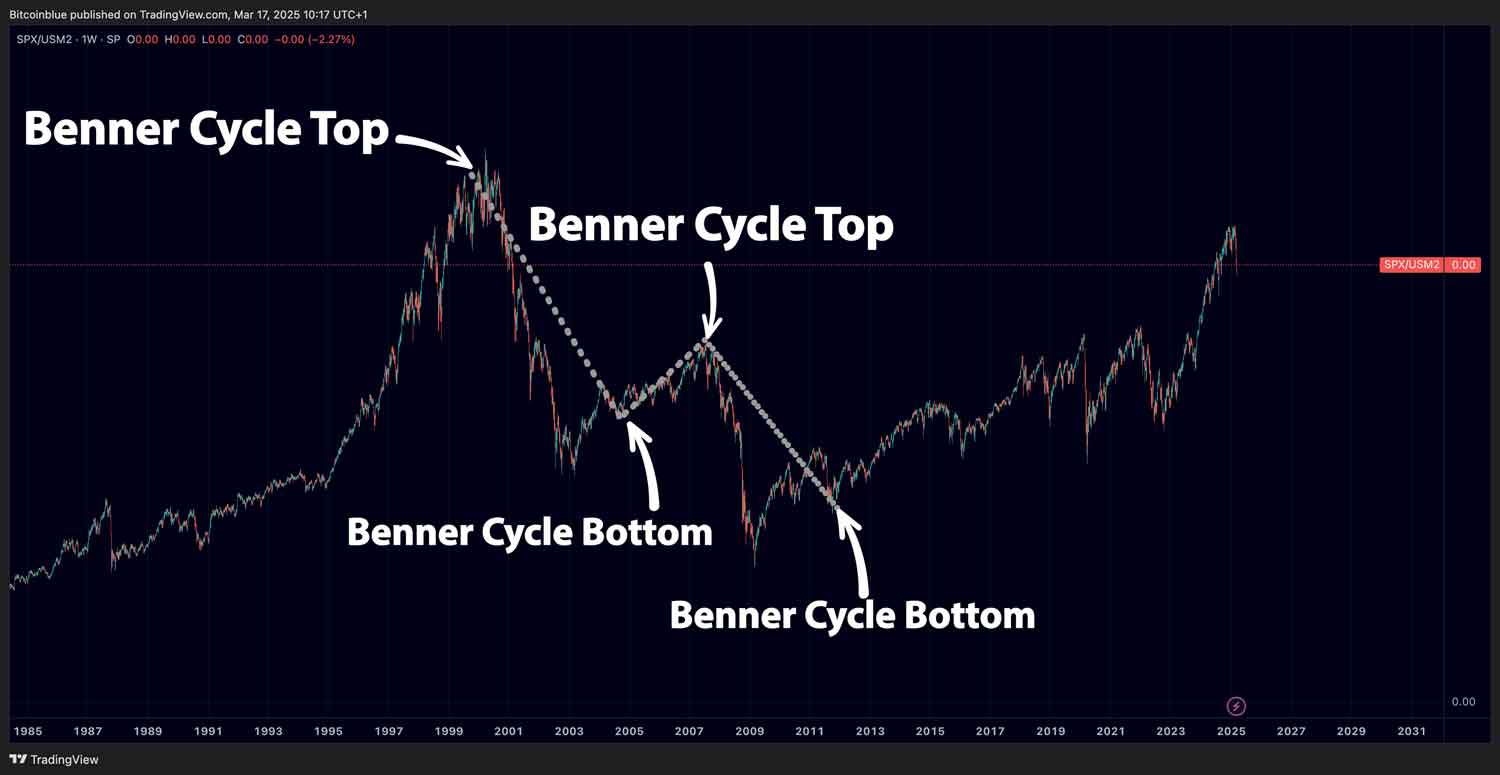 Even though it’s not 1:1 accurate, the Banner cycle clearly shows a positive correlation in forecasting the uptides and downtides of the market. And that’s what it’s all about with timing the cyclical nature of the markets, in nature, the dark nights in the summer are shorter than the nights in the winter, also in the markets, you will see some divergence from the cycle now and then but in the bigger picture, it’s showing whether we are in a “up” season, or “good” season, or whether we are in a “down” season or “recession” season.
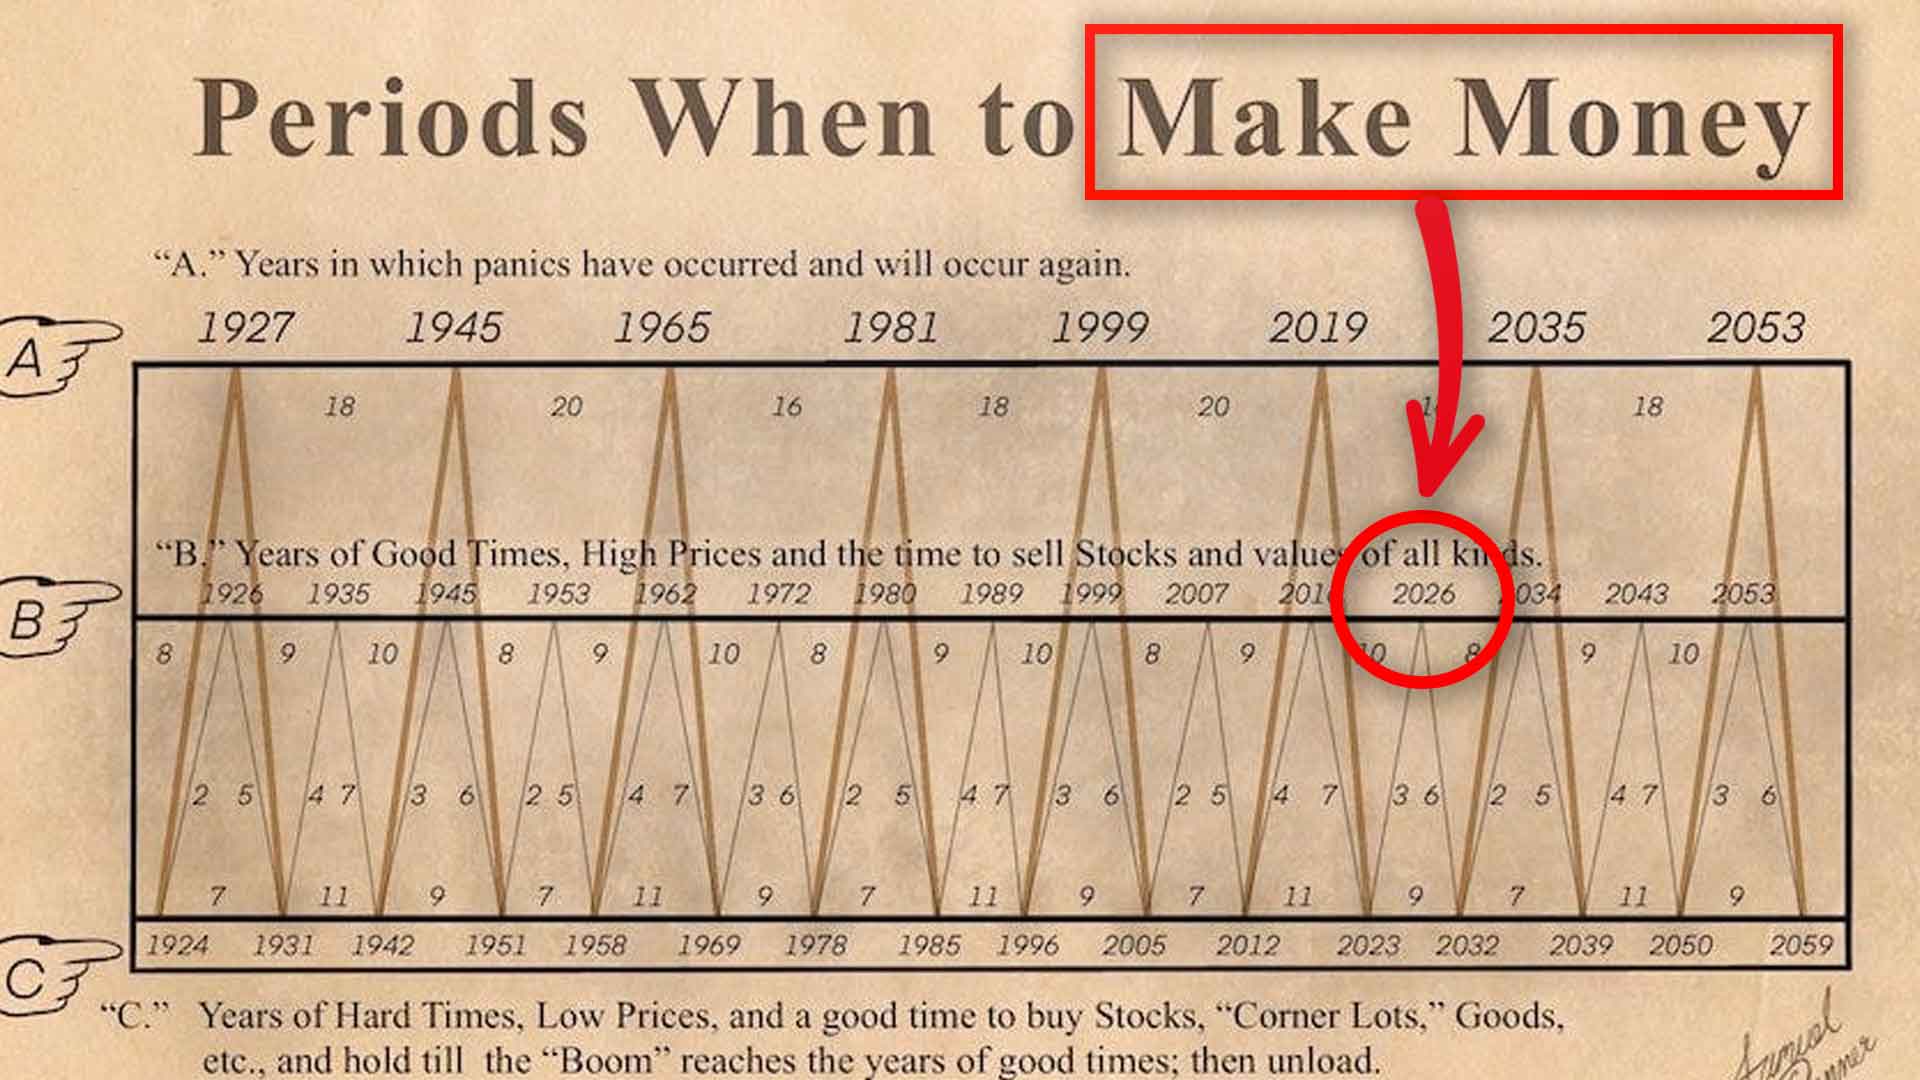
Benner Cycle Predicts Next Recession
The next recession will take place form 2026 until 2032 if we follow the Benner Cycle. So until 2026 we should still need to see “Good times”, shifting from 2026 into “Bad times” until 2032.
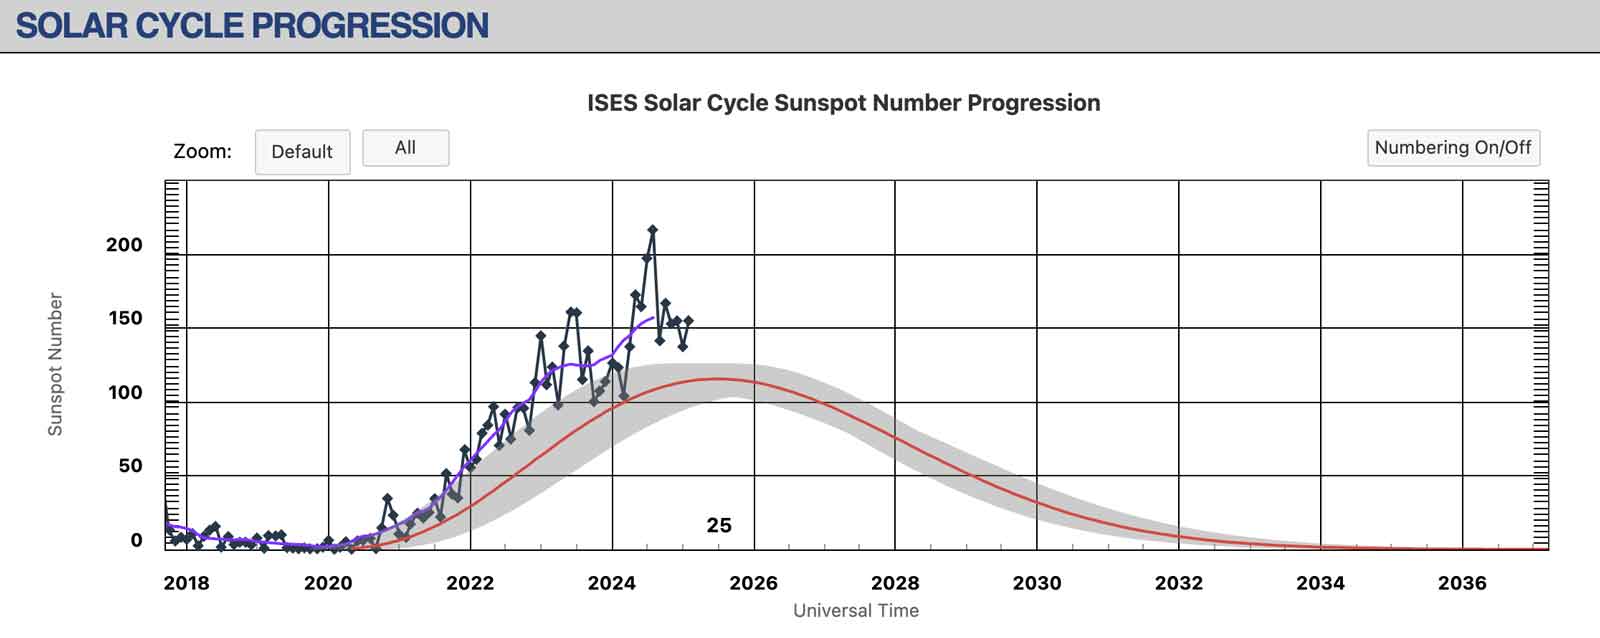
 This aligns almost exactly with the Sunspot cycles. NASA forecasts peak solar activity in 2025-2026 and afterwards decline until 2032, almost exactly the same as the Benner cycle.
 If you’d like to learn more about sunspot cycles, we’ve conducted an in-depth analysis of their correlation with the stock market and Bitcoin. Also interesting to note that the next shmita year will occur in 2028-2029. The most recent shmita year was 2021–2022 or Anno mundi 5782 in the Hebrew calendar. The next shmita cycle will be in 2028–2029, year 5789 in the Hebrew calendar. This has been an accurate predictor of negative years for the stock market.
Benner Cycle and Bitcoin
Conclusion
History has shown that markets move in cycles, much like the changing seasons. The Benner Cycle and Sunspot Cycles reveal recurring patterns of booms and busts, offering insights into the timing of economic downturns. While not a perfect 1:1 predictor, the Benner Cycle has successfully forecasted major recessions and market peaks, including the 1929 crash, the 2008 financial crisis, and the dot-com bubble.
Looking ahead, if these cycles continue to hold true, we may see "good times" until 2026, followed by a recession phase from 2026 to 2032, a prediction that aligns closely with NASA's Sunspot Cycle forecasts. While no cycle is perfect, understanding these historical patterns can help us prepare for potential market shifts.