TradingView Alternatives for Crypto Traders: Meet WhalePortal Charts
If you're an active trader, chances are you rely heavily on TradingView. It's one of the most powerful charting platforms available, offering a wide range of trading pairs, technical indicators, and even advanced features like custom scripting and plotting. TradingView is widely used by retail traders, professionals, and even by institutions.
However, despite its strengths, some traders run into limitations, especially when it comes to integrating real-time external data. Indicators on TradingView don't always work well with live data feeds from exchanges, such as funding rates, premium indexes, or other off-platform metrics. As a result, many traders who rely on this kind of data are actively looking for better alternatives.
In this article, we’ll have a look at Whaleportal, one of the best alternatives for charting when it comes to short-term trading.
Why You Might Need a TradingView Alternative
Live Exchange data
One of the unique aspects of the crypto market is that you can access live exchange data. This adds an entirely new dimension to market analysis. In traditional financial markets, most exchange APIs are not public, so you can't see how many traders are long or short, or how much liquidity is sitting in the order books. Institutions have long used this kind of data for their own advantage, while the public was left in the dark.
Crypto changed that. Exchange data is now public, allowing anyone to see what's happening behind the scenes in real time. You can monitor how much money is currently in open positions, whether traders are leaning long or short, if the futures price is trading at a premium or discount, and even whether positions were opened using market or limit orders. This kind of insight offers a powerful edge for short-term price prediction. However, most of this live data is not available directly on TradingView.
Sentiment Analysis
Sentiment is a crucial part of market analysis, especially for short-term trading, for two main reasons:
First, it often pays to take a contrarian view when emotions in the market reach extreme levels.
Second, it's helpful to compare your own emotional state with the broader market to see if they align or diverge.
You’ve likely heard the phrase, “Buy when others are fearful and sell when others are greedy.” This well-known quote perfectly captures the importance of sentiment. Market sentiment tends to swing between extreme greed and extreme fear, and recognizing these shifts can provide valuable signals for price prediction.
However, reading sentiment from a candlestick chart alone is nearly impossible. True sentiment is often reflected in live exchange data, and even more clearly in the content being shared on platforms like YouTube and X (formerly Twitter). At WhalePortal, we scan online content daily and use it to calculate market sentiment. This data is then visualized through our sentiment heatmaps, helping traders understand how the majority is currently feeling about the market.
TradingView might be too complex
Another reason some traders prefer alternatives to TradingView is the platform’s complexity. TradingView is designed for advanced users, and to use it effectively, you often need to follow tutorials or guides due to the number of features and settings available.
Some other charting platforms are simpler because they focus on a single sector, such as crypto. They don’t include information about forex, commodities, or traditional markets, allowing users to stay focused purely on crypto.
Because of this, many traders use multiple platforms to meet their specific needs. For example, they might use TradingView for drawing chart structures and another platform for accessing real-time crypto data.
What Makes WhalePortal Different?
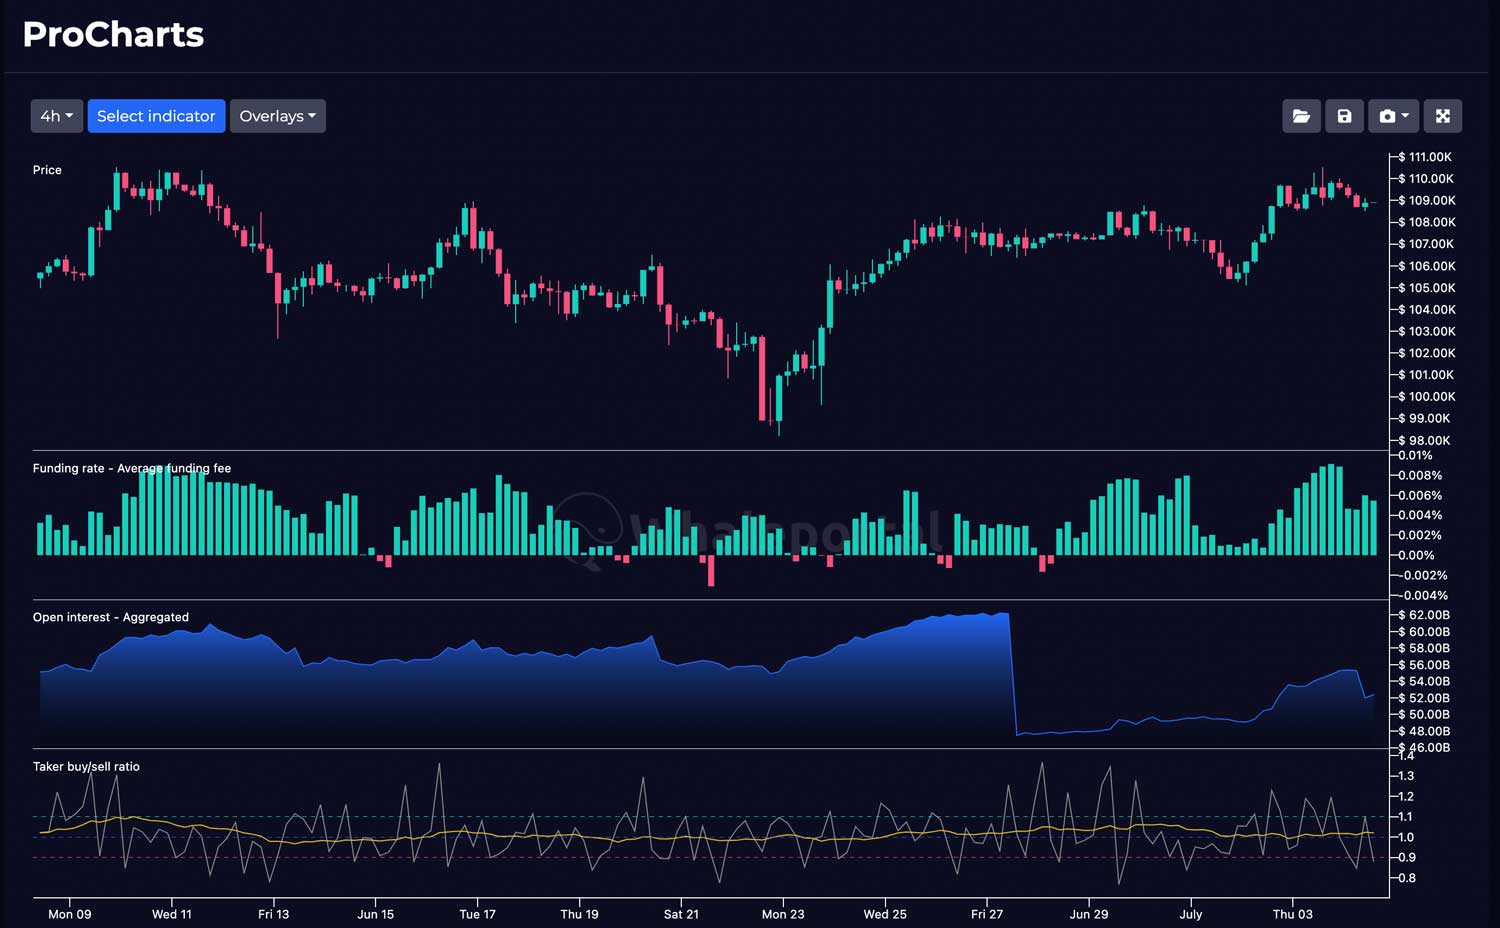
At Whaleportal, we have far more flexibility when it comes to live charts with real-time exchange data, because we built our own charting software from the ground up. This allows us to extract and display live exchange metrics, even down to the 1-minute chart.
Our platform integrates data from multiple exchanges and presents metrics you won’t find displayed like this on TradingView, including:
- Funding Rates
- Open Interest
- Premium Index
- Taker Buy/Sell Ratio
- Sentiment Heatmaps
- Buying & Selling Pressure Heatmaps
- Sector indexes (e.g. Meme Season Index)
This opens up a whole new dimension in market analysis. You can live-track what’s happening on exchanges in real time, and see it unfold candle by candle on the 1-minute chart.
A Unique Way of Presenting Data
Another thing that sets Whaleportal apart is the way we visualize data. Take the Premium Index, for example:
You don’t just see whether it’s positive or negative, you also see candle shadows, or what we call “extremes.” These extremes often align with turning points in the market, giving you a visual cue for potential reversals.
Our Sentiment readings are also in a league of their own. Whaleportal scans the internet daily, analyzing top influencers, content, and social trends, to generate a quantified market sentiment score. This helps traders understand the emotional state of the market and avoid common psychological traps.
The Taker Buy/Sell Ratio is another powerful metric rarely found on other platforms. It shows the balance between market and limit orders, revealing whether aggressive buyers or sellers are dominating.
When you combine all these tools, you get an insanely detailed picture of what's happening on the exchanges in real time.
A Heatmap Like No Other
Our Buying and Selling Pressure Heatmap is truly unique. It visually highlights where pressure is building, whether from buyers or sellers, giving you intuitive insight into potential market moves. We wrote an entire article about it, which you should have a look at.
Sector Indexes (E.g. Meme Season Index)
Another unique feature on Whaleportal is the ability to go beyond individual tokens and analyze sector performance. In addition to showing what’s happening on exchanges in real time, Whaleportal also tracks the outperformance of key crypto clusters, such as Meme coins, Gaming, DeFi, and ISO 20022 tokens.
This allows traders to identify, based on real data, which sectors are currently showing the most strength. Instead of guessing, you can now factually see where momentum is building, so you can focus on the areas of the market offering the best opportunities.
Use case for Joe: Short-term Leverage Trader
Joe is an active crypto trader who prefers to enter positions before the crowd jumps in. He’s most comfortable taking longs when the majority of traders are slightly bearish and the market pressure is still low.
His approach starts with technical analysis. Joe identifies key support and resistance levels and waits patiently for the price to either bounce from support or break through resistance.
As the price approaches a key support zone, Joe turns to WhalePortal to validate his setup using live exchange data. He’s looking for confirmation that aligns with his thesis, ideally:
- Low open interest (not many traders are involved yet)
- Negative or low positive funding rates (market leaning short)
- Negative premium index (futures trading below spot)
If two out of these three conditions are met, Joe feels confident that sentiment is still leaning against the move he’s planning to take, and he enters his long position.
WhalePortal helps him not just with timing, but with confidence in the data. Instead of guessing, Joe trades with confirmation from the crowd’s behavior and exchange dynamics in real time.
TradingView vs WhalePortal: Key Differences at a Glance
Let’s have a look at a comparison between TradingView and Whaleportal.
|
Feature |
TradingView |
Whaleportal |
|
Focus |
All asset classes (Stocks, Crypto etc.) |
Crypto-only |
|
Ease of Use |
Advanced Charting |
Plug-and-Play, easy-to-use |
|
Real-time Exchange Data |
Limited |
Yes, Live from major crypto exchanges |
|
Live Sentiment |
Not available |
Available |
|
Draw on Chart |
Yes |
No |
|
Best for |
Multi-asset Technical Analysts |
Short-term Crypto Traders |
Both platforms offer unique strengths, but WhalePortal picks up where TradingView leaves off, by providing live exchange data and a laser focus on crypto markets. This is what makes crypto trading so unique: there's an entirely new layer of data available that traditional platforms often miss. As a trader, you want to be able to tap into that depth.
TradingView remains an essential tool for charting and technical analysis. Especially with advanced tools like TradingView Webhooks, so you can automate your trading, or set alerts, etc.
But if you're looking to go deeper, WhalePortal complements it perfectly by offering real-time insights, sentiment tools, and full access to every corner of crypto-specific data.
Frequently Asked Questions
Is WhalePortal free to use?
WhalePortal is mostly free when looking at exchange data. Sentiment Heatmaps and Buying and Selling pressure heatmaps can only be accessed through PRO accounts.
Can I use WhalePortal instead of TradingView?
You can, especially if you focus on short-term crypto trading. Many traders use both: TradingView for technical drawings and WhalePortal for real-time sentiment and data.
Does WhalePortal support live data?
Yes, WhalePortal uses live exchange data such as funding rates, open interest, taker ratios, and more.
Related Articles:
- Best Crypto Exchanges for Passive Income
- CopyTrading on Decentralised Exchanges
- Altseason Index Explained