Bitcoin Moon Cycle Strategy: How Lunar Phases May Predict Price Moves
 Using cycles of the moon for trading might sound far-fetched; however, many traders have been watching the various moon phases and using them for price predictions on Bitcoin and other assets. The main idea on how the moon can affect the price of crypto is due to its potential influence on mass human emotions. It is known that the moon has an effect on water due to its gravitational pull, and the human body is composed mostly of water. It is also researched that traffic accidents occur more often during full moon periods.
The Moon Cycle
The Moon’s cycle can be measured in different ways depending on your point of view, whether you're observing from Earth or from space.
Synodic Cycle
The synodic cycle is based on the Moon’s phases as seen from Earth, relative to the Sun. It takes approximately 29.5 days to complete one full cycle, from full moon to the next full moon. This is the cycle most people are familiar with, as it reflects the changing appearance of the Moon in the night sky.
Sidereal Cycle
The sidereal cycle, on the other hand, measures the Moon’s orbit relative to distant stars. It lasts about 27.3 days. This cycle is shorter because, as the Earth orbits the Sun, the Moon must travel a bit farther to realign with the Sun from our perspective. But when viewed from a fixed point in space, the Moon completes its orbit around Earth in less time.
In this article, we’ll mainly be looking at the phases of the moon as seen from Earth, as that is fitting with the theory, most with the moon’s effect on Earth. This is the Synodic cycle.
Phases Of The Moon
The Moon goes through several distinct phases during each synodic cycle, which lasts approximately 29.5 days. Throughout this period, its brightness gradually changes, starting with the New Moon, when the Moon is barely visible from Earth, and reaching its peak at the Full Moon, when it appears fully illuminated and brightly lights up the night sky.
There are eight main phases of the Moon. It starts with the New Moon, when the Moon is not visible from Earth. Then it moves into the Waxing Crescent, where a small sliver of light begins to appear. After that comes the First Quarter, when half of the Moon is lit up. The next phase is the Waxing Gibbous, where most of the Moon is visible but not yet full. Then we reach the Full Moon, when the Moon is fully bright and lights up the sky. After the Full Moon, the light starts to fade in the Waning Gibbous phase. Then comes the Last Quarter, where again only half is visible, but the opposite side compared to the First Quarter. Finally, there's the Waning Crescent, where only a small curved slice of the Moon is still lit before it becomes a New Moon again.
Research & Scientific studies
Several academic studies have explored the potential link between lunar phases and financial markets, with surprisingly similar outcomes. Notably, Yuan, Zheng, and Zhu (2006) and Dichev and Janes (2001) both found that stock market returns tend to be higher around new moons and lower around full moons, suggesting a possible influence of the Moon on investor sentiment. While these studies provide no clear causation evidence, the consistent pattern across different markets points to a correlation. Although not widely accepted in mainstream finance, these findings highlight that lunar rhythms may subtly affect market behaviour.
The reason I’m mentioning these studies and their findings is that it looks like the correlation with the Bitcoin price is similar.
Bitcoin Price and Moon Cycle
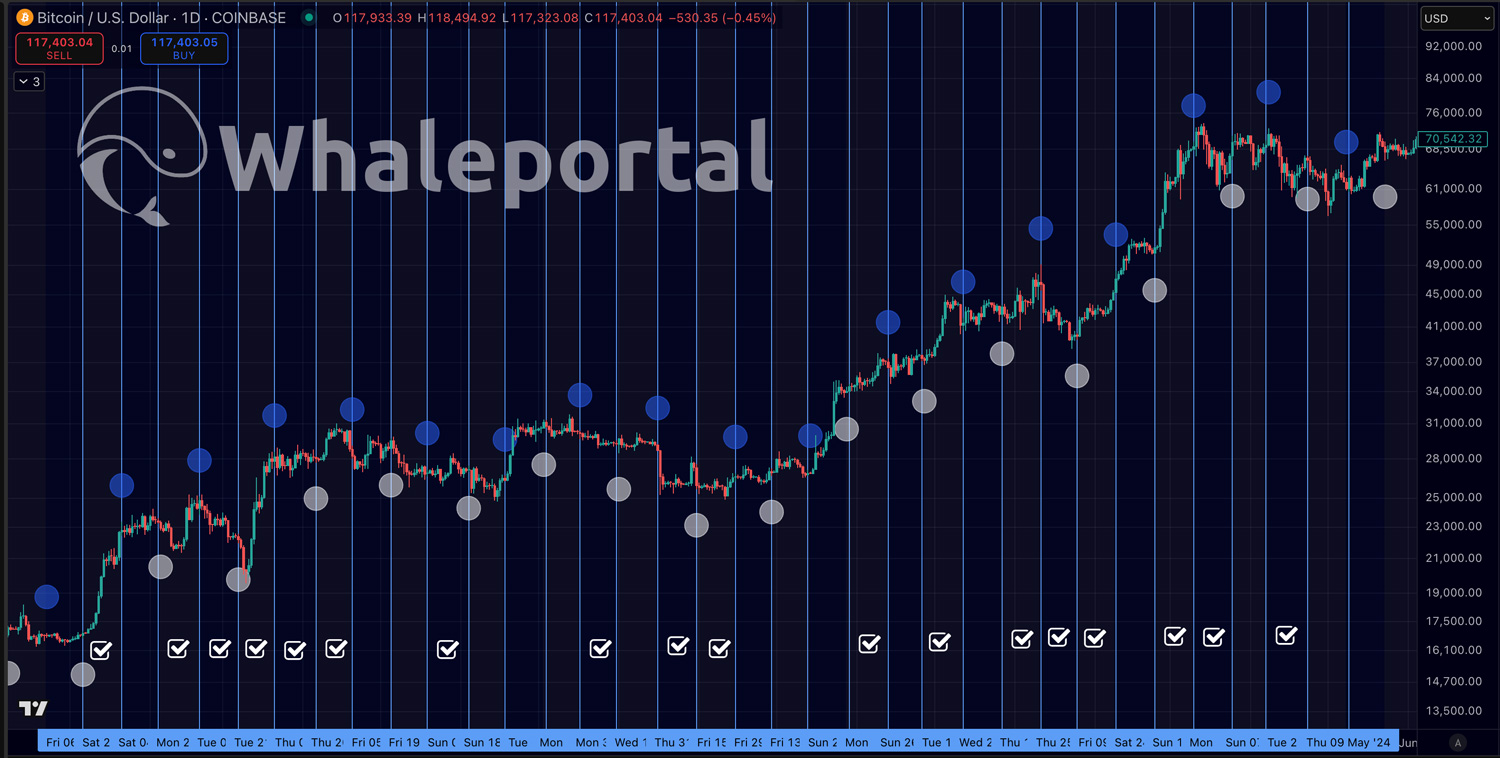
Before we’re going to talk about how you can incorporate the cycle of the moon in your trading strategy, let’s first have a look at the correlation of the price action with the moon cycles. We use in this example the Moon Phases indicator on TradingView.

In the chart above, you can see the Bitcoin chart with the new moons (Blue) and the full moons (White). What research has shown is that the period from a full moon to the new moon prices often go up, and from a full moon to a new moon prices go down. In the chart above, we’ve tracked 33 instances, and 18 of them turned out to be right. That is roughly 55%, and maybe at first glance it doesn’t look that much. But it means that statistically, at least in this example, there seems to be some truth in it. And with the example above is just when you use it in the simplest way possible.
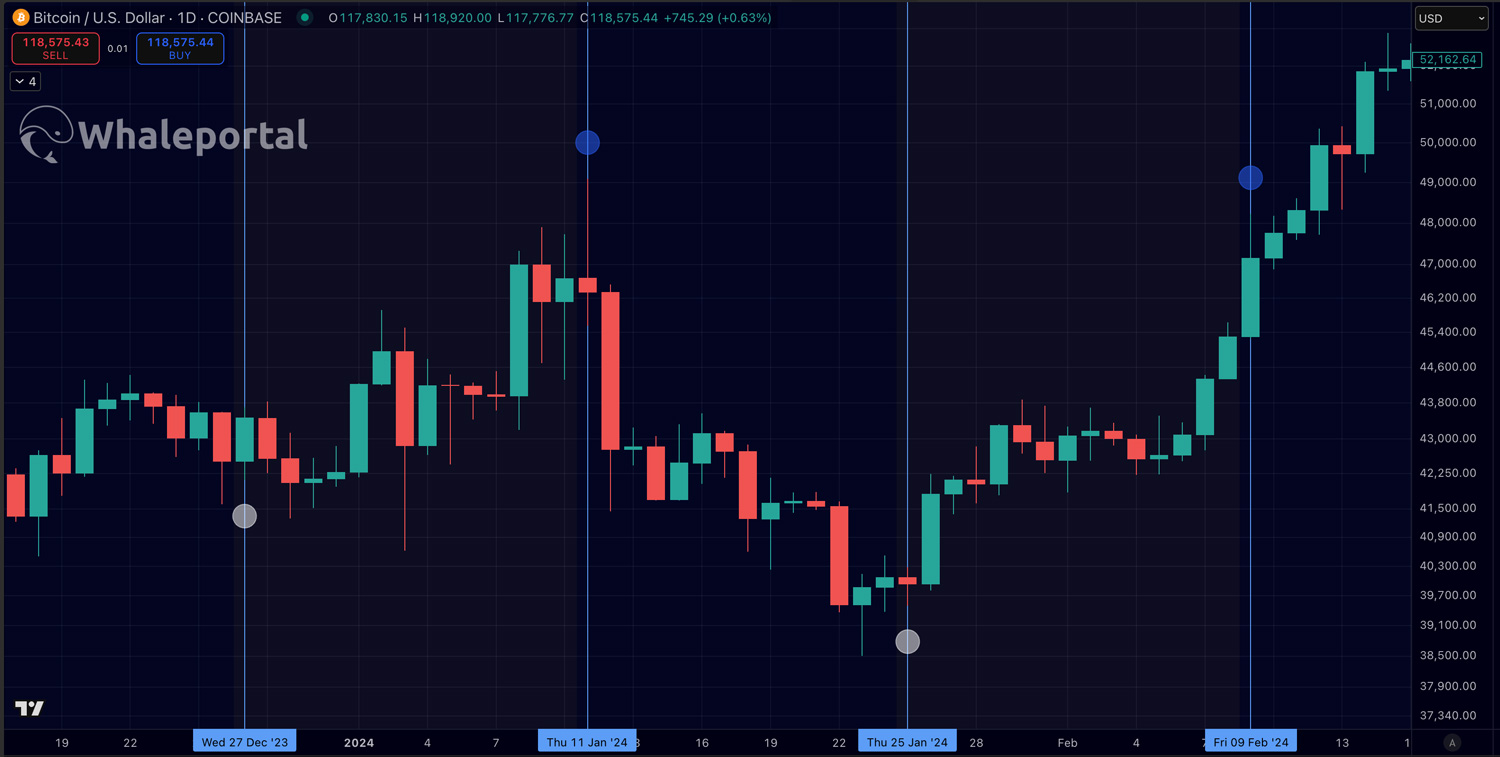
 In the chart above, you can see almost a perfect execution of the moon phases correlation with the Bitcoin price. From full moon to new moon, with prices at new moon being higher and sometimes even the exact top before going lower again into the next full moon.
Moon Phases In Trading Strategy
Some hedge funds and proprietary trading firms quietly consult financial astrologers like Ray Merriman or draw on the legacy of W.D. Gann, whose techniques involved planetary and lunar cycles. While these methods are rarely acknowledged publicly due to their reputation as pseudoscience, they are sometimes used as timing tools alongside technical analysis. Most traders either fear the stigma of being associated with astrology or prefer to keep any edge it provides a closely guarded secret.
Let’s have a look at how you can implement the Moon cycles with other indicators and metrics to increase the accuracy and profitability.
Moon Cycles and the 60-Day Bitcoin Cycle
Bitcoin is going through 60-day cycles, and this might be one of the best cycles that you can combine with the moon cycles. Funny enough, 2 moon cycles almost equal 60 days, so they might explain the same thing (2 x 29.5 days). The advantage of the 60-day cycle on Bitcoin is that there are some extra criteria to verify the cycle lows, for example, after the timing period has passed for a cycle low, a clear break above the 10-day moving average.
One way to use it is to wait to open long positions until the moon phase is going from full moon to new moon, and after a new 60-day cycle low is confirmed.
Moon Phase and Price Structure
If you’re a pattern trader and you see, for example, a falling wedge. You can use the phase of the moon as extra confirmation. If you see the price breakout right after the full moon occurs, that could function as an extra confirmation.
Funding Rates and Premium Index
To be more confident that the price will increase during the moon phase from full moon to new moon, you can add other metrics such as funding rates and the premium index to see whether those metrics, as well, confirm an increased likelihood of price increase. When the funding rates are extremely negative, the chances of a short squeeze increase. Therefore, it becomes more likely for the price to climb. If that were the data profile in the timeframe right after a full moon, it could increase the accuracy of the moon phase strategy. You can use the premium index too, or combine them.
Other planetary cycles (Sunspot cycle, Benner Cycle)
The Moon is not the only celestial body used in financial astrology. Other planetary influences, such as solar activity, also play a role. For example, the Sun and its 11-year sunspot cycle have long been studied for their potential impact on markets. It’s also widely believed that Samuel Benner incorporated solar activity into his calculations for the well-known Benner Cycle.
Conclusion: Can the Moon Be Used For Bitcoin Trading?
While the idea of trading Bitcoin based on the Moon’s phases may seem unconventional, the data shows there’s a repeatable pattern worth noting. With studies linking lunar cycles to human behavior, and possibly market sentiment, it makes sense to at least explore this as part of a broader trading toolkit.
By combining the Moon phase strategy with proven techniques like the 60-day Bitcoin cycle, chart patterns, funding rates, and premium index data, traders can potentially improve their timing and decision-making. It’s not about astrology versus analysis, it’s about using every possible edge.
The Moon won't predict Bitcoin's price alone, but it might just shine a little light on when to pay closer attention.
FAQ: Bitcoin & Moon Cycle Trading
What is a moon cycle in trading?
A moon cycle refers to the lunar phases, particularly the transition from full moon to new moon and vice versa. Some traders believe these phases can influence market sentiment and price movements, especially in emotional markets like crypto.
Is there scientific evidence that the moon affects Bitcoin price?
While there's no definitive proof, several studies suggest that financial markets may be influenced by lunar phases. The correlation is not universally accepted but has shown consistent patterns in some cases.
How do I see moon phases on a Bitcoin chart?
You can use the Moon Phases indicator on TradingView. It visually marks new moons and full moons on the price chart, allowing you to observe historical patterns and test the strategy.
What’s the win rate of this strategy?
In one example with 33 moon cycles, 18 showed the expected price direction—roughly a 55 percent success rate. While not overwhelming, it can provide an edge when combined with other signals.
Can I combine moon cycles with other trading tools?
Yes. Many traders combine moon phases with tools like the 60-day Bitcoin cycle, price structure (like wedges or channels), funding rates, and premium index data to improve timing and confidence.
Related articles:
- Which Crypto Exchange Has the Lowest Fees? VIP & Market Maker Programs Compared
- Bitcoin 60-Day Cycle Explained: How Traders Use It to Time the Market
- Best Decentralized Crypto Exchanges in 2025 (Ranked & Compared)