You’re Reading Liquidation Heatmaps Wrong (Fix These Mistakes)
Introduction: Why Liquidation Heatmaps Matter
What are liquidation heatmaps?
Liquidation heatmaps visually represent liquidation levels in the market. When a trader opens a leveraged Bitcoin trade, it comes with a specific liquidation price. Areas with a high concentration of liquidations highlight regions of significant liquidity, which can influence market movements.
Why traders use them to identify potential price movements.
When a high concentration of liquidations accumulates around a specific price level, the likelihood of the price reaching that level increases statistically, acting like a magnet for market movements. However, many traders rely solely on this indicator and mistakenly believe that the price must reach the liquidation level directly or in the short term. In this article we’ll look at the most common mistakes traders make when using Liquidation heatmaps.
Assuming Liquidation Zones Always Trigger Price Reversals
Many traders believe that price will always bounce or reverse to clusters of high liquidation zones. Liquidation clusters indicate areas where traders get stopped out, but trends can continue if momentum is strong. So seeing a big cluster of liquidation at a specific level does not mean that the price has to go there directly, or can not go continue in the opposite direction. It just increases the likelihood of going to these levels, eventually.
How to avoid this mistake?
You can avoid this mistake by looking at the price structure and clear support and resistance levels. Do the liquidation levels correspond with a pattern in the chart? Also, using the sentiment can be very powerful for short-term trading and will help you to get a better market picture combined with the liquidation heatmaps.
Relying Solely on Liquidation Heatmaps
Some traders only use the liquidation levels to make price predictions, ignoring other market indicators.
How to avoid this mistake?
Although this could work as liquidation heatmaps is a strong indicator, you might increase your profitability if you combine it with other metrics such as Funding Rates and Sentiment. Often other indicators like funding rates and sentiment will just increase the reliability of the liquidation heatmaps. Heatmaps should be used as part of a larger strategy, not the sole indicator. If you want to see how experienced traders combine multiple indicators into one clear system, check out our complete crypto indicator framework.
Using The Wrong Timeframe
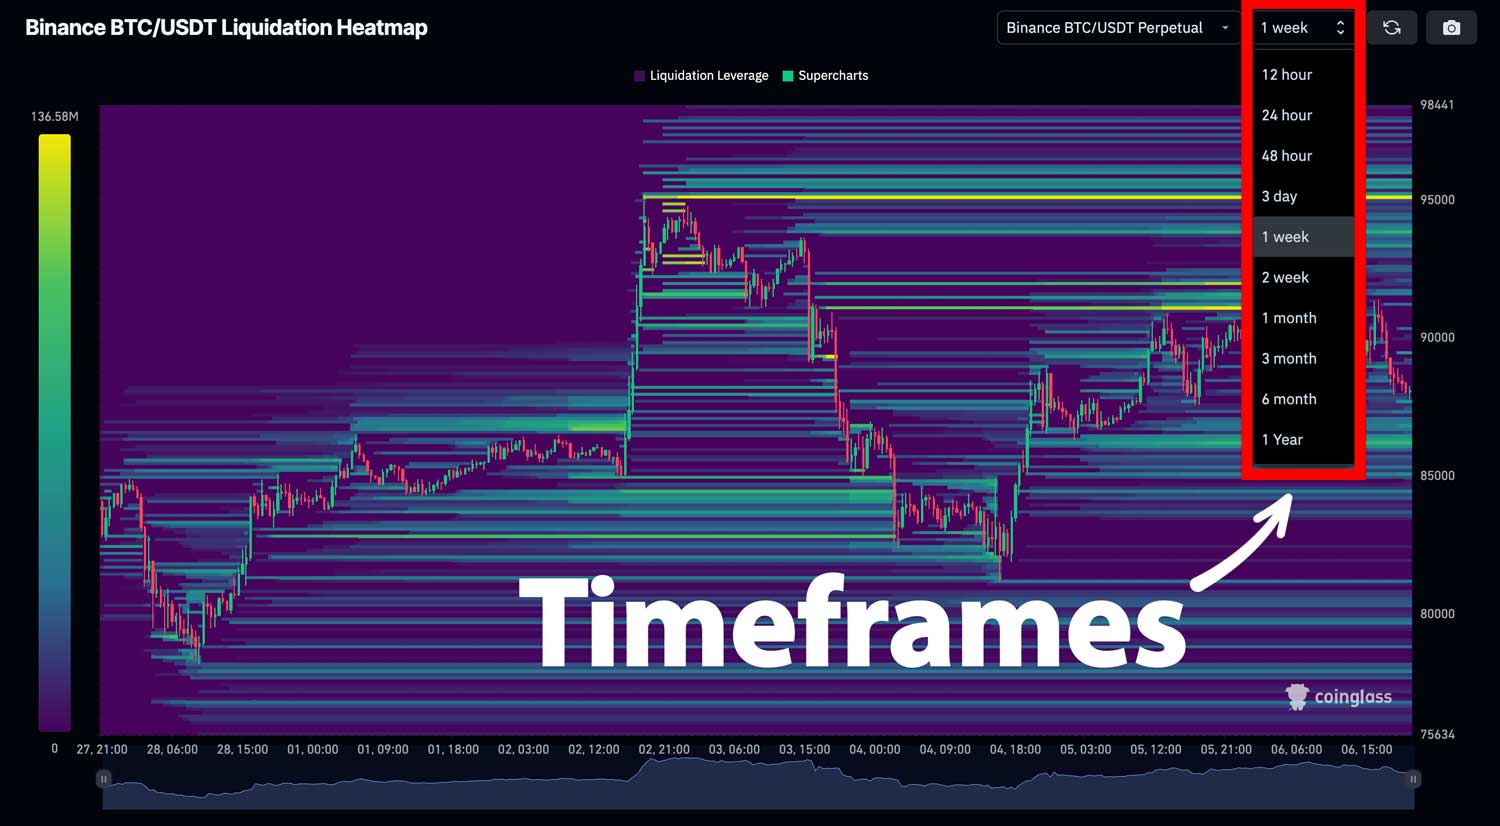
Many traders misuse timeframes, often focusing on long-term liquidation levels while expecting short-term results. Liquidation heatmaps allow for analysis across different timeframes, meaning that while long-term data may show liquidity above the current price, short-term data could indicate liquidity below it. This suggests that the price might dip lower first before potentially moving higher.
How to avoid this mistake?
Always look at multiple timeframes and make a clear difference between short-term liquidity levels and mid to long-term liquidity levels.
Looking At The Wrong Exchanges
Many traders will look at a single exchange like Binance or Bybit, but there are a lot of different exchanges and it's always good to look at multiple exchanges. Liquidation levels should occur around similar levels across multiple exchanges for it to be more trustworthy. On Coinglass Liquidation Heatmaps you can find data from various exchanges like Bitget, OKX, Deribit, Gateio, and many more.
Extra Tip: Confirmations
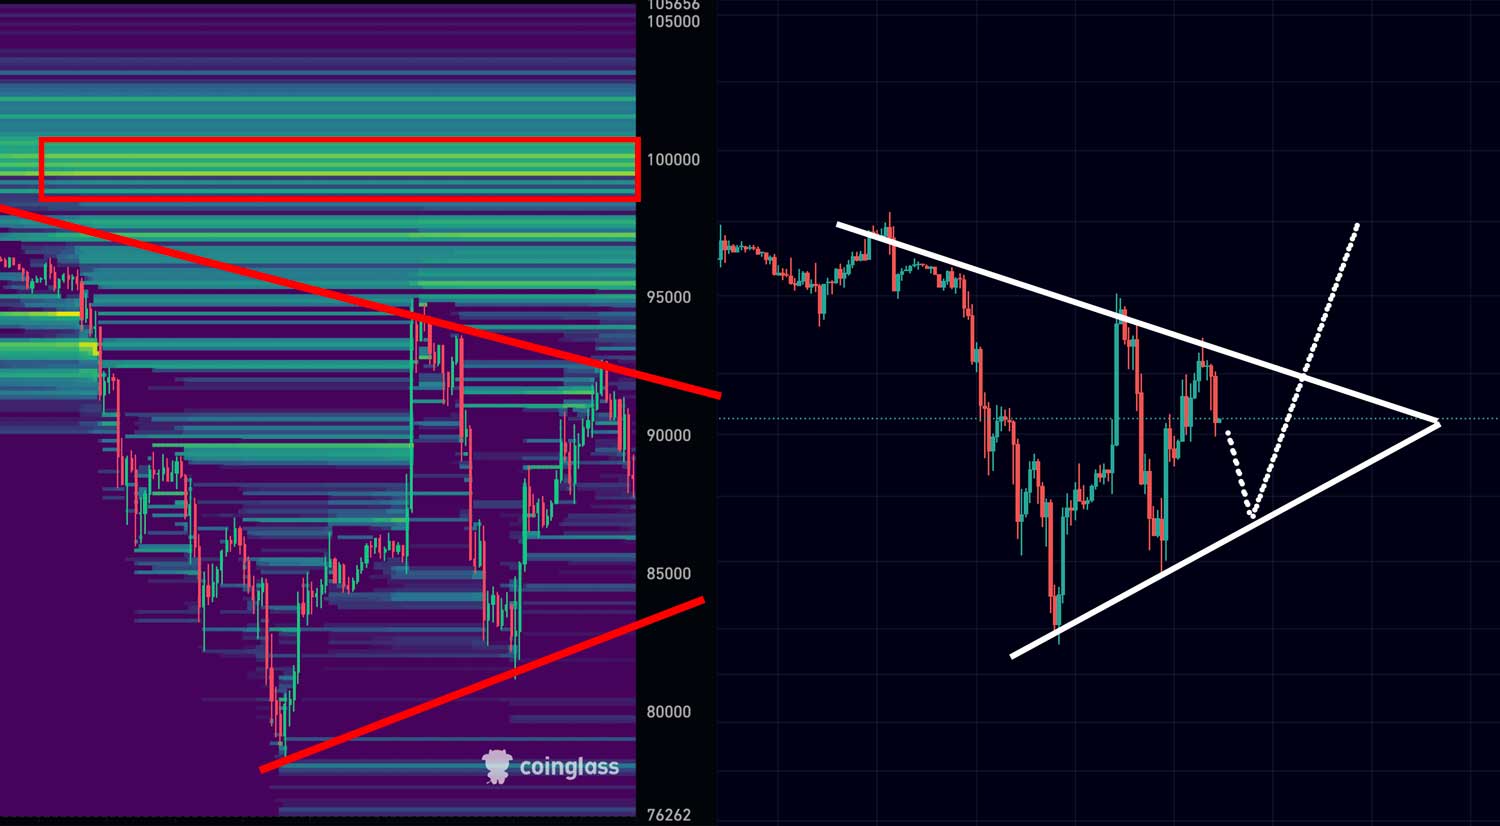
An extra way to get better results when using the liquidation heatmaps is to combine them with other analysis methods such as pattern trading. If you take a triangle formation for example, and you're expecting the triangle formation to break to the upside, you can have a look at the liquidation heatmaps and see whether liquidity is concentrated in the same direction you expect the price to go. This should in fact increase the likelihood of the price going in that direction theoretically. Trading remains a game of probabilities and therefore there are never any guarantees.
Conclusion
In conclusion, liquidation heatmaps are a powerful tool for traders, but they should not be used in isolation. Avoiding common mistakes such as assuming liquidation zones always trigger reversals, relying solely on heatmaps, and misusing timeframes can significantly improve trading decisions. By combining heatmap data with other indicators like sentiment, funding rates, and price structure, traders can develop a more comprehensive and reliable strategy. Always consider multiple timeframes and confirm signals with additional market insights to maximize the effectiveness of liquidation heatmaps.