Crypto Sector Indexes Explained
Crypto Sector Indexes Explained: See Which Crypto Narrative is Outperforming
We all know the Altseason Index, one of the most popular charts in crypto to see whether capital is rotating from Bitcoin into altcoins. However, it’s still not very clear to which altcoins this capital is rotating and in the past years we have seen a clear trend in crypto that certain sectors will rise together.
We had the ISO20022 boom in late 2024, where most altcoins actually did nothing except the ISO20022 altcoins. In 2025 we are seeing the privacy sector outperforming the rest of the market. All these opportunities where not visible in the Altseason index. That’s why we created the Crypto Sector Indexes.
Crypto Sector Indexes are tracking various sectors and bundles of cryptocurrency tokens and measure their strength against Bitcoin. The viewer can see directly in the chart which sector is outperforming the rest of the market and where most opportunities are present.
In short: The Crypto Sector Indexes track various token sectors like Memes, Privacy or Gaming in terms of their strength to see to which sector capital is rotating.
What Are Crypto Index Seasons?
Crypto is all about narratives; liquidity flows from one narrative to another. If you really zoom out, then you might even say that the whole world of investing is about narratives. A very strong narrative in recent years has been artificial intelligence. This narrative causes almost every company that is doing something with artificial intelligence to go up in value due to the hype. If you could see this hype early on, it’s way easier to jump in the right boat. The same happens with crypto, money flows from Meme seasons into Privacy seasons into DeFi tokens, for example. The art is to be early in catching these narratives to be able to take advantage of it.
How To Read The Crypto Season Index?
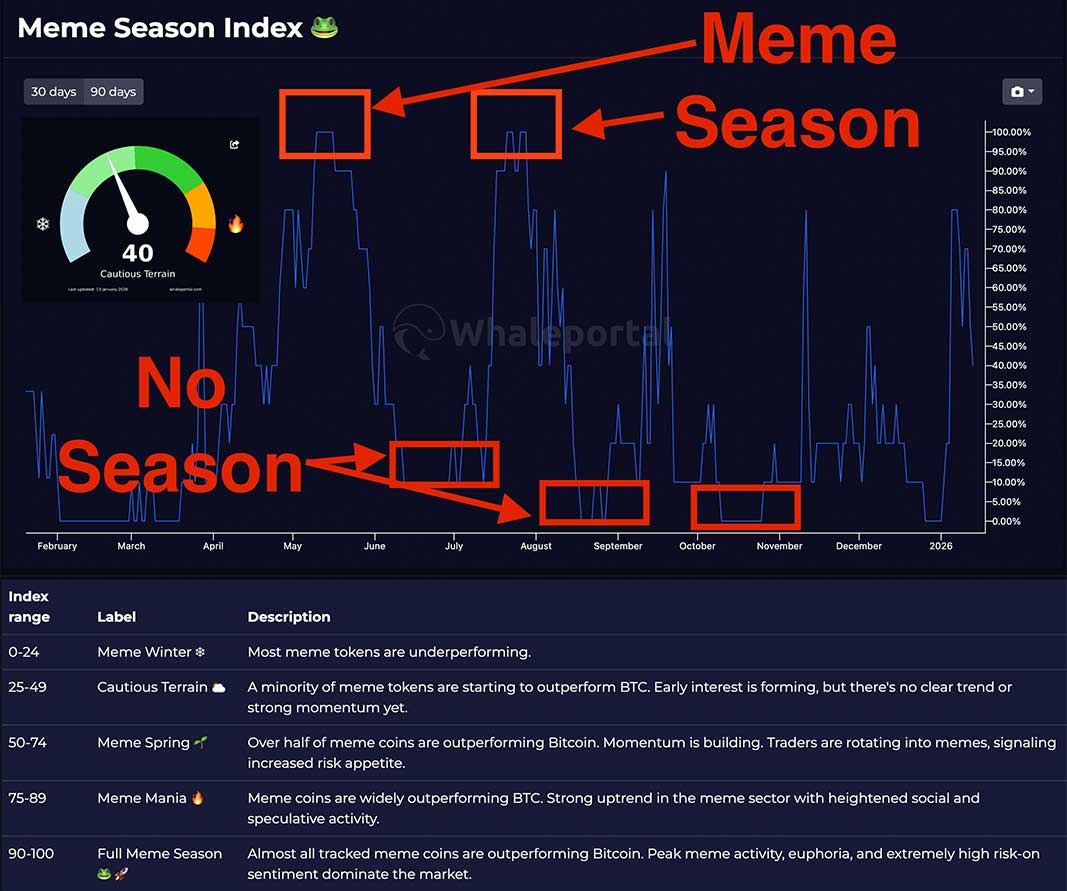
Let’s take, for example, the Meme Season Index, these numbers will go between 0 and 100. With 100 meaning all Meme tokens are outperforming, and 0 meaning none of them are outperforming. There are various seasons memes are going through and those are the following:
0 -24 Meme Winter: Most Memes do not show any strength
25-49 Cautious Terrain: We might see the start of something here
50-74 Meme Spring: More than half of the Meme tokens are showing strength
75-89 Meme Mania: Most Memes are outperforming
90-100 Full Meme Season: Almost if not all, Meme tokens are outperforming. Full Meme Season
This works the same with the other Season Indexes such as the Gaming, DeFi and ISO20022 etc.
So you can always see what the season is and how strong this sector is outperforming and if there might be a bigger trend forming.
Which Crypto Season Indexes Are Available?
At the moment, there are 7 different sector indexes available on Whaleportal which are the following:
Meme Season Index: Meme Tokens (e.g. SHIB, DOGE)
Gaming Season Index: Gaming Tokens (e.g. MANA, SAND)
DeFi Season Index: DeFi Tokens (e.g. UNI, AAVE)
ISO20022 Season Index: ISO20022 Compliant Tokens (e.g. XRP, XLM)
Privacy Season Index: Privacy Tokens (e.g. ZEC, DASH)
DINO Season Index: Tokens from the DINO era (e.g. DASH, LTC)
Made In USA Season Index: Tokens established in the United States (e.g. SUI, FIL)
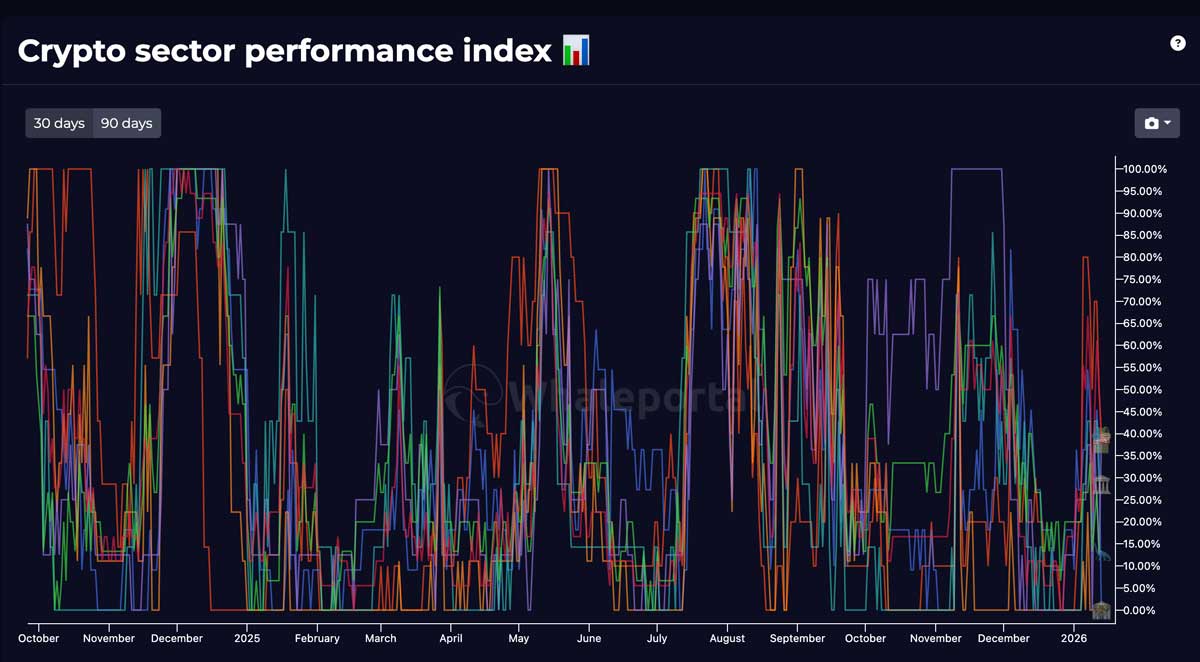
Next to the 7 individual season indexes, there is also a Crypto Sector Performance Index, which shows all values of all indexes in one chart. This might be the most important chart to view in one second, exactly which sector is outperforming the most.
How To Use The Season Index In Your Trading Strategy?
The way to use the Season Indexes is by using them as an indicator to view where opportunities are. I’ve experienced that if you know where liquidity is flowing and you’re early enough to notice this, you can capitalise on it as the trend or hype takes a while before it wears off.
So the best way to use it is to use it to determine where you’re going to look for trading setups, which altcoins are going be favourable when it comes down to narratives and hype. The setups on those specific altcoin charts might be more promising then taking any random altcoin that is looking good. Idk it fits in the current narrative, you have an extra confirmation and reason why it should outperform as well.
Another way I have used this metric successfully is spotting the main trend in sectors and then searching for smaller-cap tokens in that same sector that have not yet seen the hype. I did this successfully with FIRO token in 2025, a well-forgotten privacy token which did not initially pump yet in the privacy hype but followed soon after. This gave me a little more time to invest and anticipate future hype because this token was not well-known.
How Past Seasons Looked
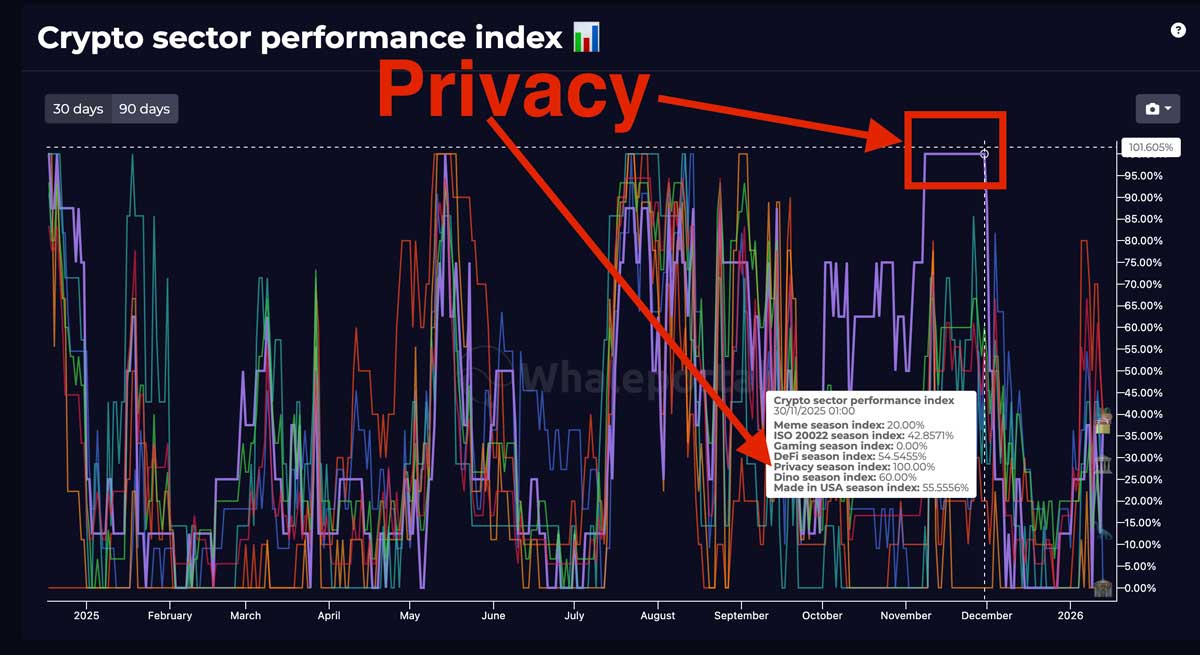
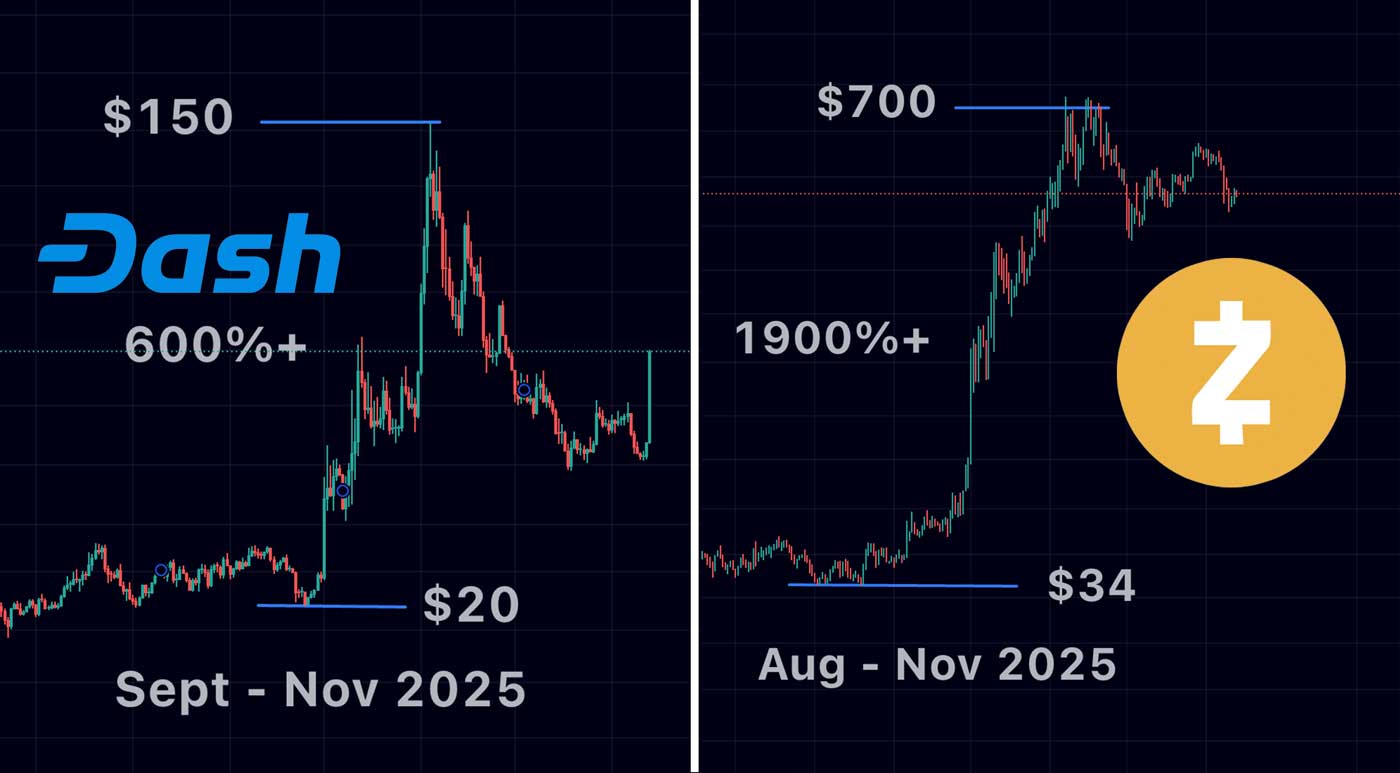
Let’s have a look at some historic season in crypto. One of the most recents biggest narratives was Privacy Tokens in late 2025. If we have a look at the crypto performance index we can see that Privacy tokens were outperforming all other sectors in late 2025.
We can see that in late 2025, Privacy sector was already outperforming the other sector indexes and consolidating sideways at pretty high levels of up to 70. After some time this shoot up to a 100 and some of the biggest altcoin pumps happened with Dash and Zcash which are both privacy tokens.
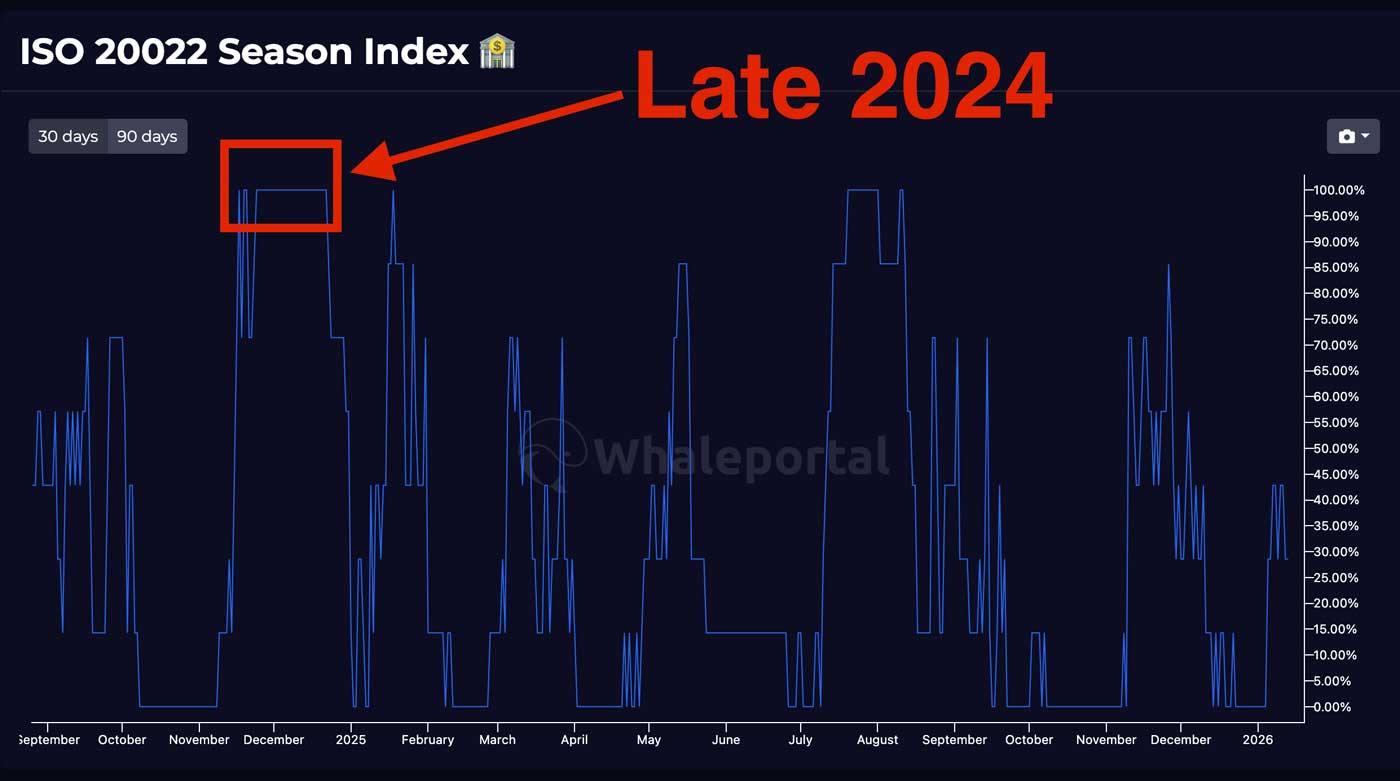
Another example is late 2024, where tokens like XRP, XLM and XDC went parabolic. These are in the categorie of ISO20022. We can see in the performance index that ISO20022 tokens heavily outperformed late 2024.
Why WhalePortal’s Season Indexes Are Different
Every day the indexes are updated with the latest market prices. We do not have a bias towards any sector so the trader will always get real-time, unbiased data from our sector indexes. This wil help any trader to spot where liquidity is flowing and where most opportunities are likely to present themselves.
It becomes even more powerful to use this metric along with other metrics such as the fear and greed index, buying and selling pressure heatmaps or the daily sentiment readings. All these metric can significantly increase the profitability ratio of the predictions although never serve as a guarantee of outcome.
Limitations and Risks
Although Season Indexes are great to spot where the trend and hype is going at the moment, they are not clear indicators for tops and bottoms. And although a strong sector indicates more likelihood of a certain token to pump it does not function as a guarantee. Indexes show sector strength, so not individual token strengths. Black Swans can always happen and it might even be a good idea to diversify within crypto sectors to limit risk.
Conclusion
Crypto moves in cycles, and the traders who consistently stay ahead are the ones who understand where liquidity is flowing and why. The traditional Altseason Index gives only part of the picture, showing when altcoins all outperform Bitcoin, but not which sectors are driving that performance. WhalePortal’s Crypto Sector Indexes fill that gap by breaking the market into clear narratives and showing, in real time, which sectors are gaining strength, where capital is rotating, and where new opportunities may emerge.
By tracking these sector trends, traders can position themselves earlier in the narrative cycle, focus on tokens with the highest probability of momentum, and avoid wasting time on altcoins that aren’t part of the current market story. Combined with other tools such as sentiment indicators, heatmaps, and broader market metrics, the Season Indexes become a powerful part of a trader’s strategy.
While no indicator can predict tops and bottoms perfectly, understanding sector performance provides a significant edge in a market driven by hype, narratives, and rapid rotation. With unbiased, daily-updated data, WhalePortal’s Season Indexes help you see the crypto market for what it really is: a constantly shifting ecosystem where early recognition of trends makes all the difference.
FAQ
What is the purpose of the Crypto Sector Indexes?
The Crypto Sector Indexes help traders identify which crypto sectors—such as Memes, Privacy, Gaming, DeFi, or ISO20022—are currently outperforming Bitcoin. This makes it easier to see where liquidity is flowing and which narratives are gaining momentum.
How often are the indexes updated?
All indexes on WhalePortal are updated daily with the latest market prices, ensuring real-time and unbiased sector strength data.
How is each sector index calculated?
Each index tracks a curated basket of tokens within a specific sector and measures their relative strength against Bitcoin. The reading is displayed on a scale from 0 to 100 to show how strongly that sector is outperforming.
What does a score between 0 and 100 represent?
- 0–24 → Sector Winter (no strength)
- 25–49 → Cautious Terrain (early signs)
- 50–74 → Sector Spring (majority showing strength)
- 75–89 → Sector Mania (strong outperformance)
- 90–100 → Full Season (nearly all tokens outperforming)
This scale works for all sector indexes.
Are these indexes predictive?
The indexes are not predictive indicators. They show where strength is right now, which helps traders position themselves earlier during narrative rotations. They do not guarantee tops, bottoms, or future performance.
Can multiple sectors be in season at the same time?
Yes. While usually one or two sectors dominate, it’s possible for multiple sectors (e.g., Gaming and Memes) to show strength simultaneously during broader altcoin momentum.
Why compare everything to Bitcoin?
Bitcoin is the anchor of the crypto market. When a sector outperforms BTC, it shows that capital is rotating into that narrative, which is a strong signal of momentum and opportunity.
Related Articles:
- Altcoin Season Index Explained
- Williams Alligator Indicator Explained
- Bitcoin Moon Cycle Strategy