EMA Ribbon Explained - EMA Ribbon Trading Strategy for Bitcoin
The EMA Ribbon is a tool used in crypto trading to spot market trends and momentum. "EMA" stands for Exponential Moving Average, which tracks recent prices more closely than a regular moving average, making it faster to react to price changes. The EMA Ribbon shows multiple EMAs of different time periods as a band of lines on a chart, looking like a ribbon. This helps you see if the market is going up or down and when it might change direction. In this guide, we’ll explain the EMA Ribbon in simple terms, show how to use it for Bitcoin or crypto trading, and suggest ways to pair it with other tools (like funding rates or even moon phases!) to boost your trading.
What is an EMA Ribbon?
An EMA Ribbon is a group of Exponential Moving Averages (EMAs) plotted together on a chart. Instead of one EMA, it uses several (like 8 to 16) with different time periods, such as 10, 20, 30, and so on. These EMAs form a colourful band that follows the price, showing short-term and long-term trends at once.
Key Features:
- Trend Direction: If the price is above the ribbon and the EMAs are stacked (shorter ones above longer ones), it’s a strong uptrend. If the price is below with shorter EMAs under longer ones, it’s a downtrend.
- Momentum: Wide gaps between the EMA lines mean a strong, fast-moving trend. When the lines get closer, the trend may be slowing or the market might move sideways. A tight ribbon often signals that a big price move is coming.
- Support/Resistance: In an uptrend, the ribbon acts as support where the price might bounce up. In a downtrend, it acts as resistance, pushing the price down. Traders use these levels to decide when to buy or sell.
- Cross and Direction of lines: When the lines cross, red above or red below, you can view an early sign of momentum and/or trend changing.
In simple terms, the EMA Ribbon shows the market’s trend and strength clearly, like a team of moving averages working together to guide your trading.
EMA Ribbon vs. Williams Alligator
The EMA Ribbon and the Williams Alligator both use multiple moving average lines to show trends on a chart, but they work differently. The Alligator has three smoothed moving averages, called the “jaw,” “teeth,” and “lips,” which are shifted forward in time. This creates a delay, so the Alligator only signals a trend when it’s strong, helping avoid false signals but sometimes missing the start of a move. The EMA Ribbon, however, uses several exponential moving averages that react quickly to price changes without any delay. This makes the Ribbon faster at spotting trend changes, but can lead to more false signals in choppy markets. For beginners, the EMA Ribbon is often easier to use because it’s quick and shows trends across different time periods clearly.
How to Use the EMA Ribbon in Your Trading
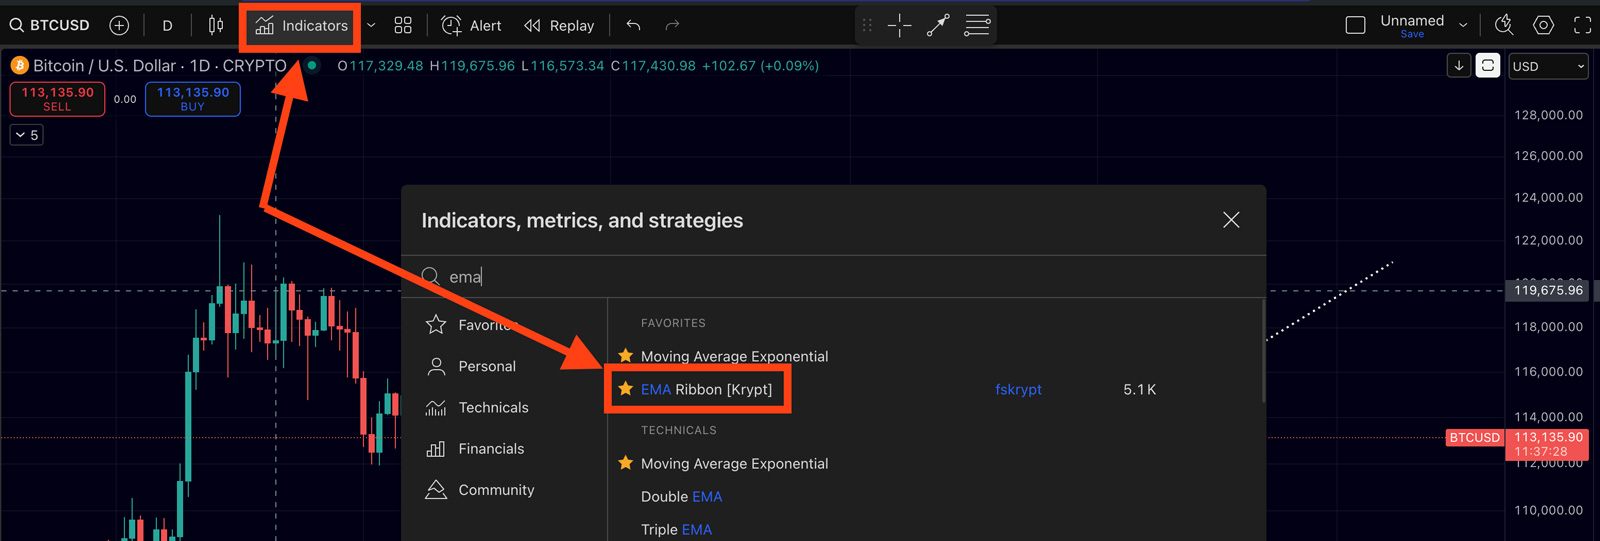
The EMA Ribbon is easy to use for trading. You can use the EMA ribbon for free on TradingView. It helps you follow the market trend and spot when it might change. Here’s a simple guide:
Check the Trend
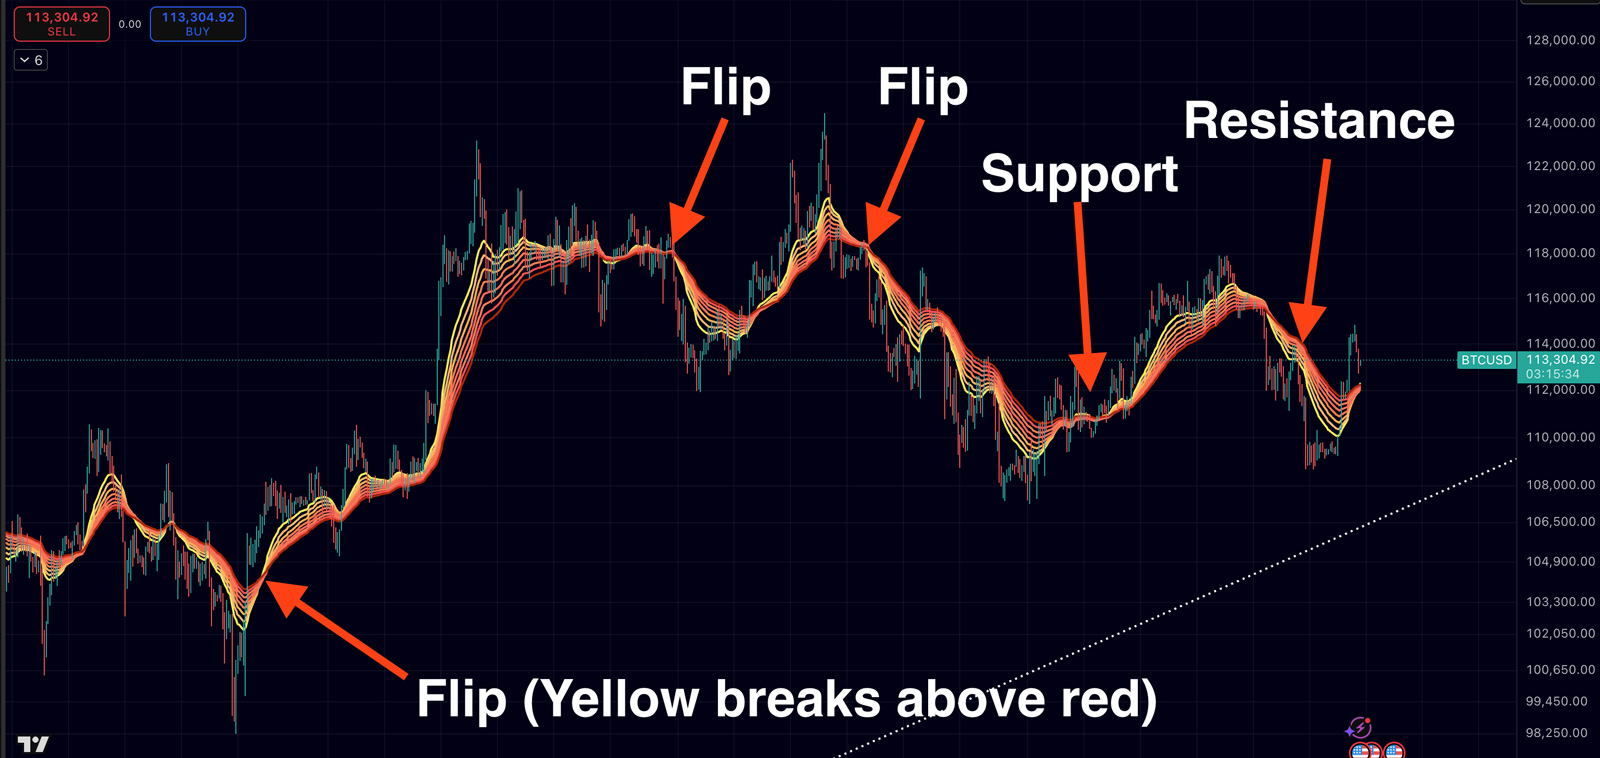
Look where the price is compared to the ribbon. If the price is above the ribbon and the EMA lines are sloping up, it’s an uptrend, consider buying, the EMA ribbon can act as support or resistance. If the price is below the ribbon and sloping down, it’s a downtrend, think about selling. If the price moves back and forth through the ribbon with no clear direction, the market is sideways, and trend signals may not work well, so wait for a clearer trend.
Watch for Breakouts or Reversals
A breakout happens when the price moves above or below the ribbon after a trend. For example, if Bitcoin is in a downtrend (price below the ribbon) and then closes above it, it’s a sign of a possible uptrend. The shorter EMAs (Yellow) crossing above the longer ones confirms this (Red). For a downtrend, it’s the opposite: the price drops below the ribbon, and shorter EMAs cross below longer ones. Trade in the direction of the breakout if other signs support it.
Pick a Timeframe
The 4-hour (4H) chart is great for crypto trading with the EMA Ribbon. The chart shown above is as well on the 4h timeframe, it works on higher timeframes as well but the amount of false signals increase in lower timeframes. It balances filtering out small price noise while still catching big trend moves. For longer-term trades, try the daily chart, same idea, but signals are slower and aim for bigger moves.
Plan Entries and Exits
Enter a trade after a breakout, ideally on a small pullback to the ribbon for a better price. For example, if the price breaks above the ribbon (uptrend), wait for a dip to the ribbon (now support) to buy. Set a stop-loss below the ribbon or a recent low. Stay in the trade as long as the price stays on the right side of the ribbon and the EMAs are spread out (strong trend). Exit when the price crosses back through the ribbon against your trade or when shorter EMAs cross below longer ones in an uptrend (or vice versa).
Practice and Tweak
The EMA Ribbon works best in trending markets. In choppy markets, you might get false signals where the price briefly crosses the ribbon but reverses. Practice on past charts to learn how it behaves. You can adjust the EMAs or timeframe to fit your style. The goal is to follow the ribbon’s trend and exit when it shows the trend is weakening or reversing. It’s a clear, visual tool that helps beginners trade with less emotion.
Make sure to always test often and realise that past results are never guarantees for future results, but in this guide, we simply explain how you can use the EMA ribbon in your trading strategy. Now we’re going to look at how t combine this indicator with other indicators.
Combine the EMA Ribbon with other indicators
The EMA Ribbon can sometimes give false signals, like when the price briefly crosses the ribbon but quickly reverses, especially in choppy or volatile crypto markets. To improve accuracy, pair the EMA Ribbon with other tools to confirm signals. Here’s how:
Wait for Confirmation
Don’t act on a breakout until the candle closes above or below the ribbon. A quick spike that doesn’t hold is often a false move. For extra caution, wait for one or two candles to stay on the right side of the ribbon or for shorter EMAs to clearly cross longer ones to confirm the trend.
Check Funding Rates
In crypto futures, funding rates show if traders are mostly betting on price going up (positive rate) or down (negative rate). Extreme rates often signal a reversal. For example, if the ribbon shows a bullish breakout and funding rates are very negative (many traders are short), it supports an uptrend, as shorts may get squeezed. If the ribbon signals a bearish move and funding is very positive (too many longs), it backs a downtrend. Use funding rates as a sentiment check, not the main signal.
Look at Moon Phases or 60-Day Cycles
Some traders use lunar cycles or time patterns for extra clues. Bitcoin may perform slightly better around new moons and weaker near full moons, with a small edge in price moving up from full-to-new moon phases. Bitcoin also tends to hit lows every 60 days, often starting a rally. If a bullish ribbon signal aligns with a new moon or a 60-day cycle low, it strengthens the case for an uptrend. A bearish signal near a full moon or cycle high adds confidence to a downtrend. These are secondary tools, so use them only to back up the ribbon, not as the main reason to trade.
Use Classic Technical Analysis
Check for other signs, like chart patterns (e.g., a triangle breakout or double-bottom) or key support/resistance levels. Look at indicators like RSI or MACD to see if they support the ribbon’s signal. If the ribbon shows a trend change and other factors align, like a bullish pattern, negative funding rates, and a new moon, it’s a stronger signal. If the ribbon signals but nothing else matches, be cautious.
Summary: The EMA Ribbon is great for spotting trends, but it’s not perfect. Combine it with candle confirmation, funding rates, cycles, or technical analysis to filter out false signals. Trade when multiple clues point the same way for better odds.
Conclusion
The EMA Ribbon is an easy-to-use tool for spotting market trends and momentum, perfect for beginner traders. It shows whether buyers or sellers are in control by displaying multiple exponential moving averages in one clear view, covering short-term and long-term trends. On a 4-hour chart, popular in crypto, it helps you follow big trends and spot when they might end.
No indicator is perfect, though. False signals can happen, especially in wild Bitcoin swings or flat markets. To improve accuracy, pair the EMA Ribbon with tools like RSI, support/resistance levels, funding rates (showing trader sentiment), or even lunar cycles for timing. This reduces mistakes and strengthens your trades.
Always manage risk: use stop-losses, control position sizes, and don’t rely on just one signal. With practice, you’ll understand how the EMA Ribbon fits your trading style. It keeps trades logical, helping you avoid emotional decisions in fast crypto markets.
In short, the EMA Ribbon is great for trend-following in Bitcoin and crypto. It’s faster than similar tools like the Williams Alligator and gives a clear market picture. Use it to track trends, confirm breakouts, and measure momentum, backed by other clues. With practice, you’ll quickly read the ribbon and make better trading decisions.
Related Articles:
- Bitcoin 60-Day Cycle Explained: How Traders Use It to Time the Market
- Bitcoin CME Gaps and CME Trading Strategy Explained
- Phemex BTC Vault Review