Taker Buy/Sell Ratio Explained

What is the Taker buy/sell ratio?
Short answer: It shows whether traders are opening more long or short positions using market orders.
But this indicator has many aspects that can be understood and help you to understand the market conditions better, let’s dive in!
What does the taker buy/sell ratio represent?
The taker buy/sell ratio is the ratio between long and short positions opened with a market order.
It shows us if traders are opening more long or short orders with a market order, paying a higher fee than when doing so with a limit order. This indicator is mostly uncommon to the average trader but is exceptionally helpful in market analysis.
You might already imagine what this Taker buy/sell ratio tells us, the behavior and feeling of traders in the market.
Let’s say many traders are longing Bitcoin with a market order, it shows that those traders do not care about paying a higher fee to be in a long position and, therefore might experience some FOMO. And the opposite could be true as well, traders are more scared when they open short positions and are willing to pay a small premium for that.
Where to find the Taker buy/sell ratio?
You can view the taker buy/sell ratio for Bitcoin, Ethereum and many other alt coins on Whaleportal for free. The taker buy/sell ratio is also available in the Whaleportal Pro charts with more historical data and the possibility to combine it with other indicators.
How to read the taker buy/sell ratio?
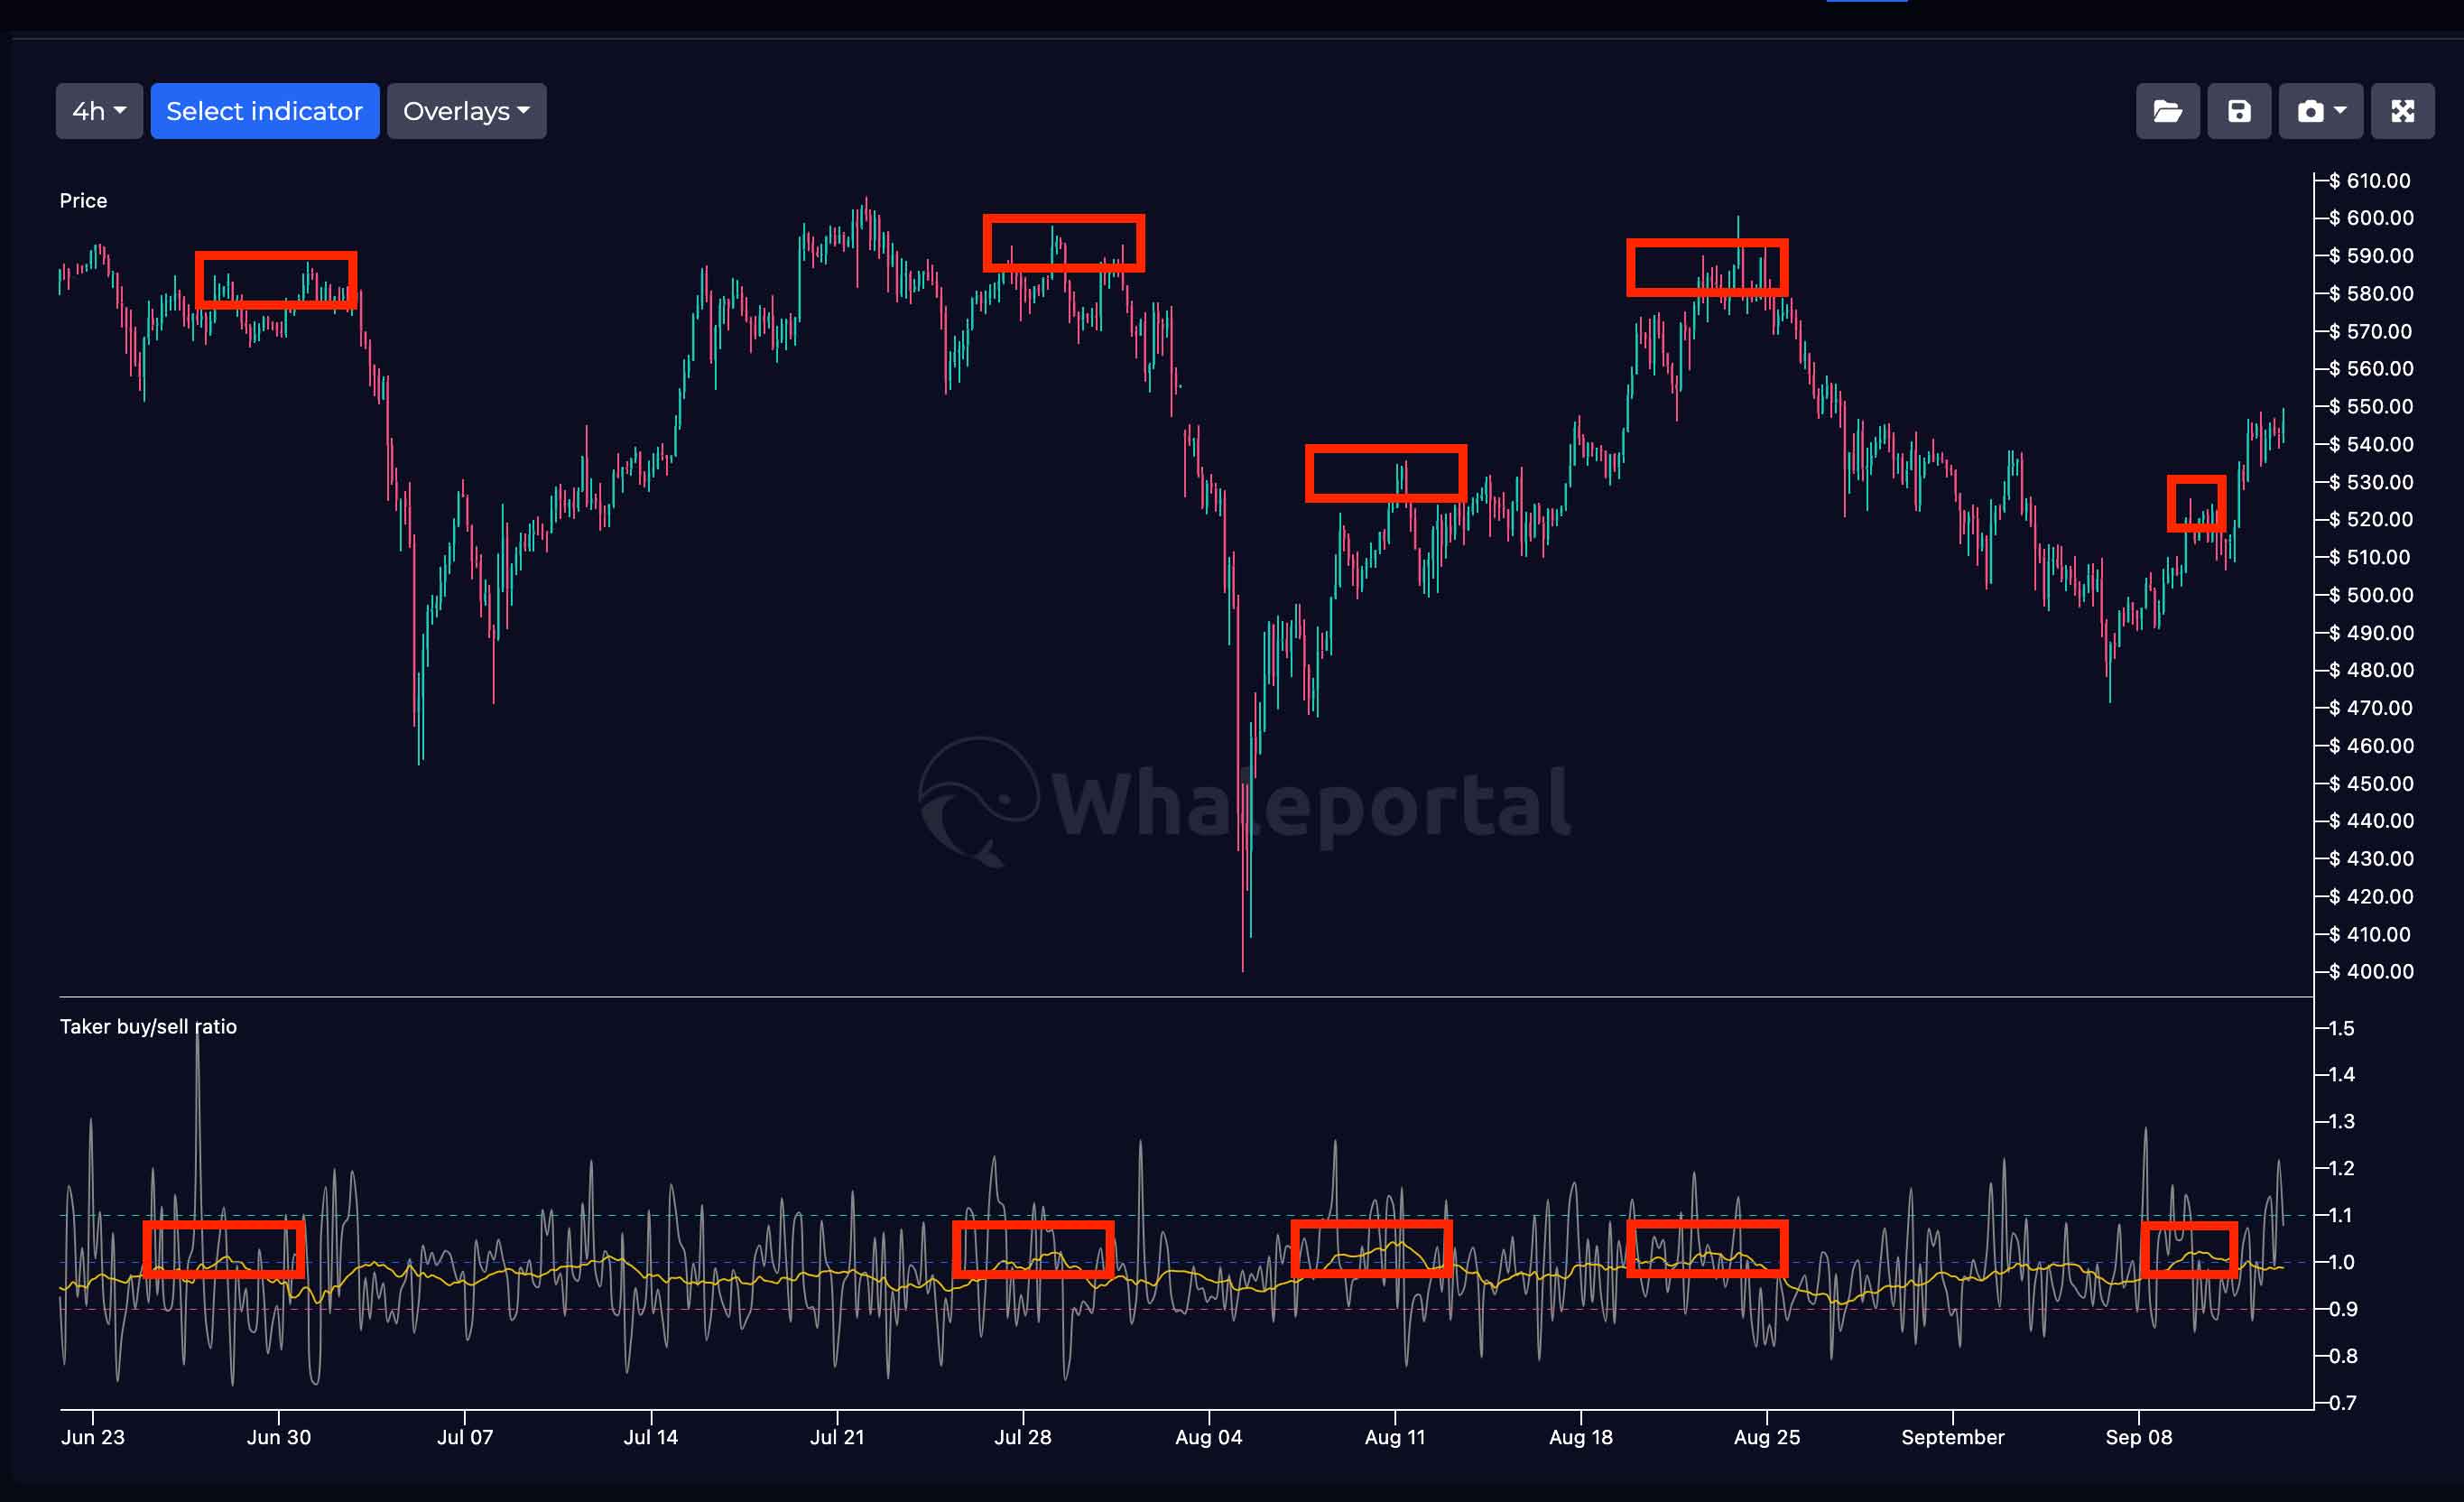
If the value (grey line) is,
Greater than 1, means more traders are opening long positions
Lower than 1, means more traders are opening short positions
There is also a moving average (yellow line), which calculates the average of the previous values measured. It gives a good average representation of the market conditions.
How can you use the Taker buy/sell ratio?
We know that emotions are one of the worst enemies of a trader, and this is also where this indicator can be very helpful with. To spot the emotional sentiment in the markets.
If the moving average is going above the neutral line (blue) it shows more traders are experiencing FOMO and want to be in a long position regardless of the “perfect entry” and are willing to pay a premium (market order). This can tell us that the emotional sentiment is reaching a peak and that could be bearish for the price.

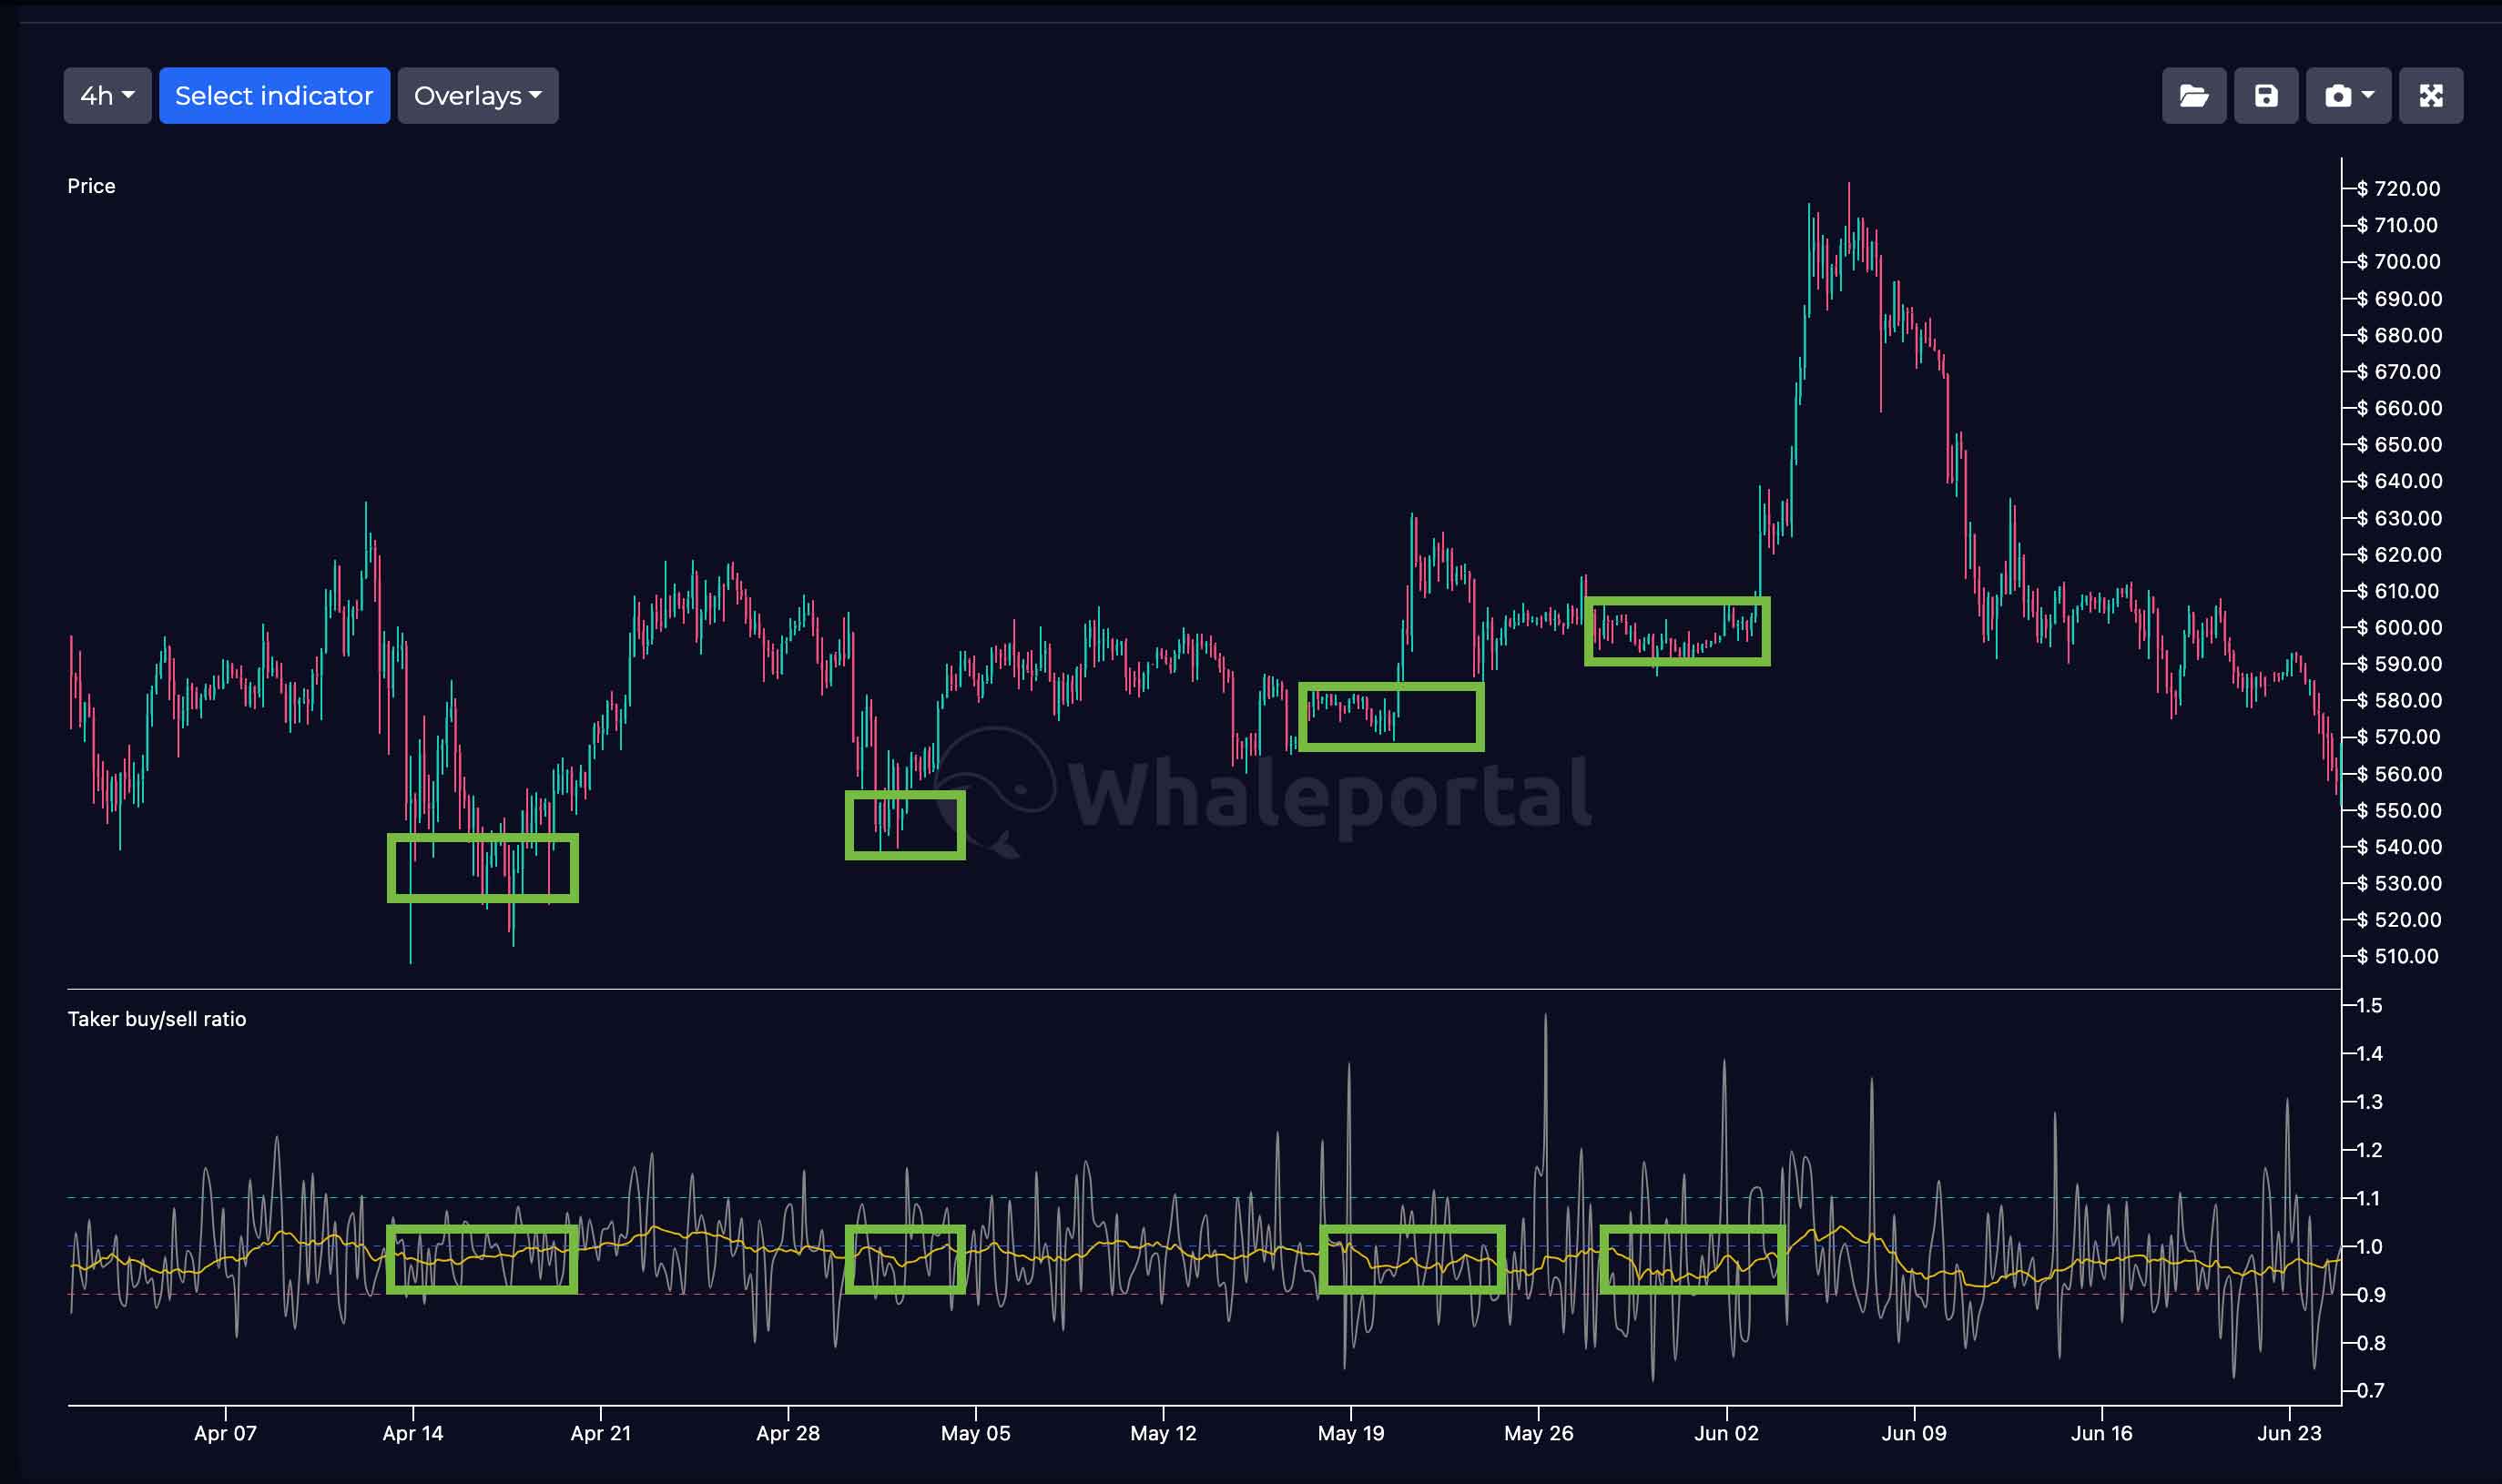
If the moving average is below the blue line, it shows more traders are eager to be in short positions, showing that we might be close to a low as we’re reaching a negative sentiment. You can view the Taker buy/sell ratio for Bitcoin chart here.
Sell when everyone is buying and buy when everyone is selling.

Here are some ways to use the taker buy/sell ratio to your advantage
- Spot FOMO/Panic: You can easily spot whenever traders experience FOMO or panic, short-term or general market conditions
- Short-term price pressure: In a bullish market you want to buy when people are panicking, and in bearish market you want to sell when people are having FOMO.
- Confirmation of other metrics: Combine it with momentum waves and buying and selling pressure for more accuracy. These indicators can complement each other and increase the understanding in market conditions from the trader.
-

You can’t control the markets, but you can control your knowledge about the markets. This is a common mistake that traders make, they like the markets to do what they want. But by analyzing the right information the right way you can take advantage of what the market does. As you can see in the chart above (from Whaleportal PRO) the Taker buy/sell ratio can confirm market conditions with various indicators like buying and selling pressure heatmaps.
Whaleportal PRO charts are helping hundreds of traders to get a better understanding of the markets and therefore gain control over their actions. In this case, knowledge is power.