VPVR Indicator Explained
Making profits in the world of cryptocurrency trading requires the help of multiple indicators like the Volume Profile Visible Range (VPVR). As the name suggests, this indicator tracks the trading volume within a specified range to help a trader decide whether an asset’s price will likely rise, stagnate, or drop. Such information is critical in deciding whether to enter, hold, or exit a trade consequently translating to a higher win rate.
What is the Volume Profile Visible Range (VPVR) indicator?
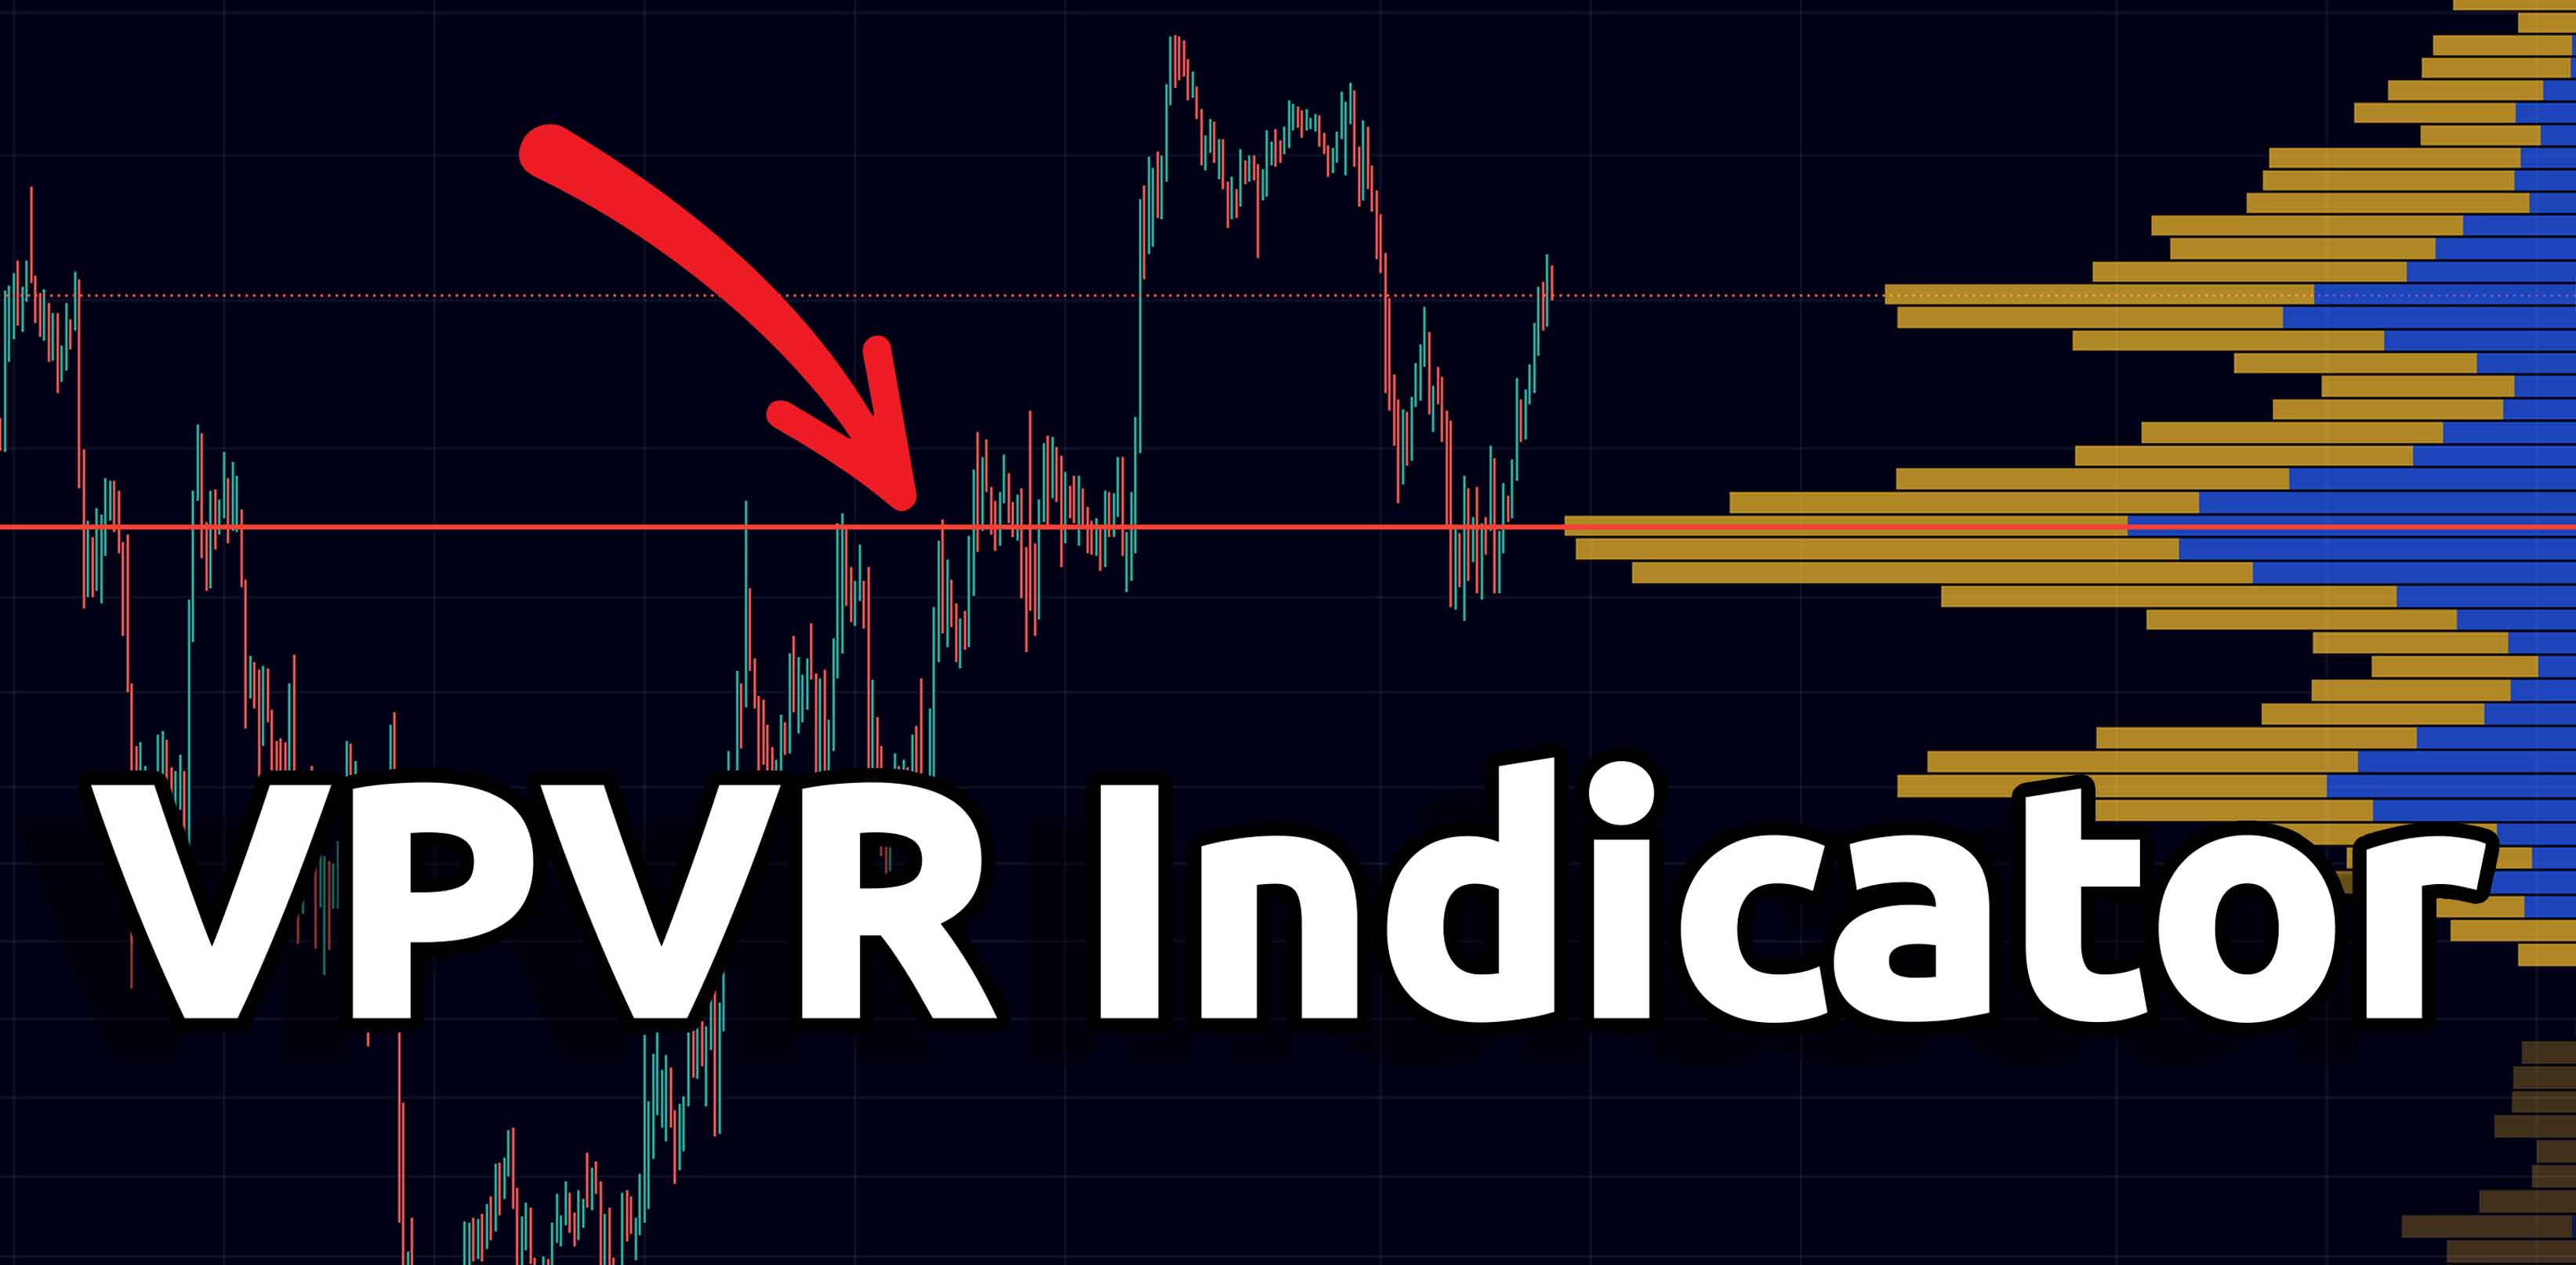
Simply put, the Volume Profile Visible Range indicator is a technical indicator that tracks and shows the amount of volume traded within a visible range of prices. VPVR gives traders a sneak peek into how other traders view specific crypto at a given. It also helps traders assess general sentiments at a particular moment.
VPVR differs from other volume-centric indicators like the Volume Profile Fixed Range in the sense that it shows trading volume distributed along a visible price range.
What makes up the Volume Profile Visible Range?
VPVR is made up of four main things:
- Price range - This determines the price ranges whose volume is shown
- Volume bars - Shows the cumulative volume within a price range
- Point of control - Abbreviated POC, it highlights the price that commanded the most volume. It’s shown as a red line.
- Value area - Shows where 70% of the volume was/is concentrated. The value area has a high and low point both of which represent the upper and lower parts of the area
- High and low volume nodes - These indicate areas where high and low volumes were registered.
Where do you find the Volume Profile Visible Range indicator?
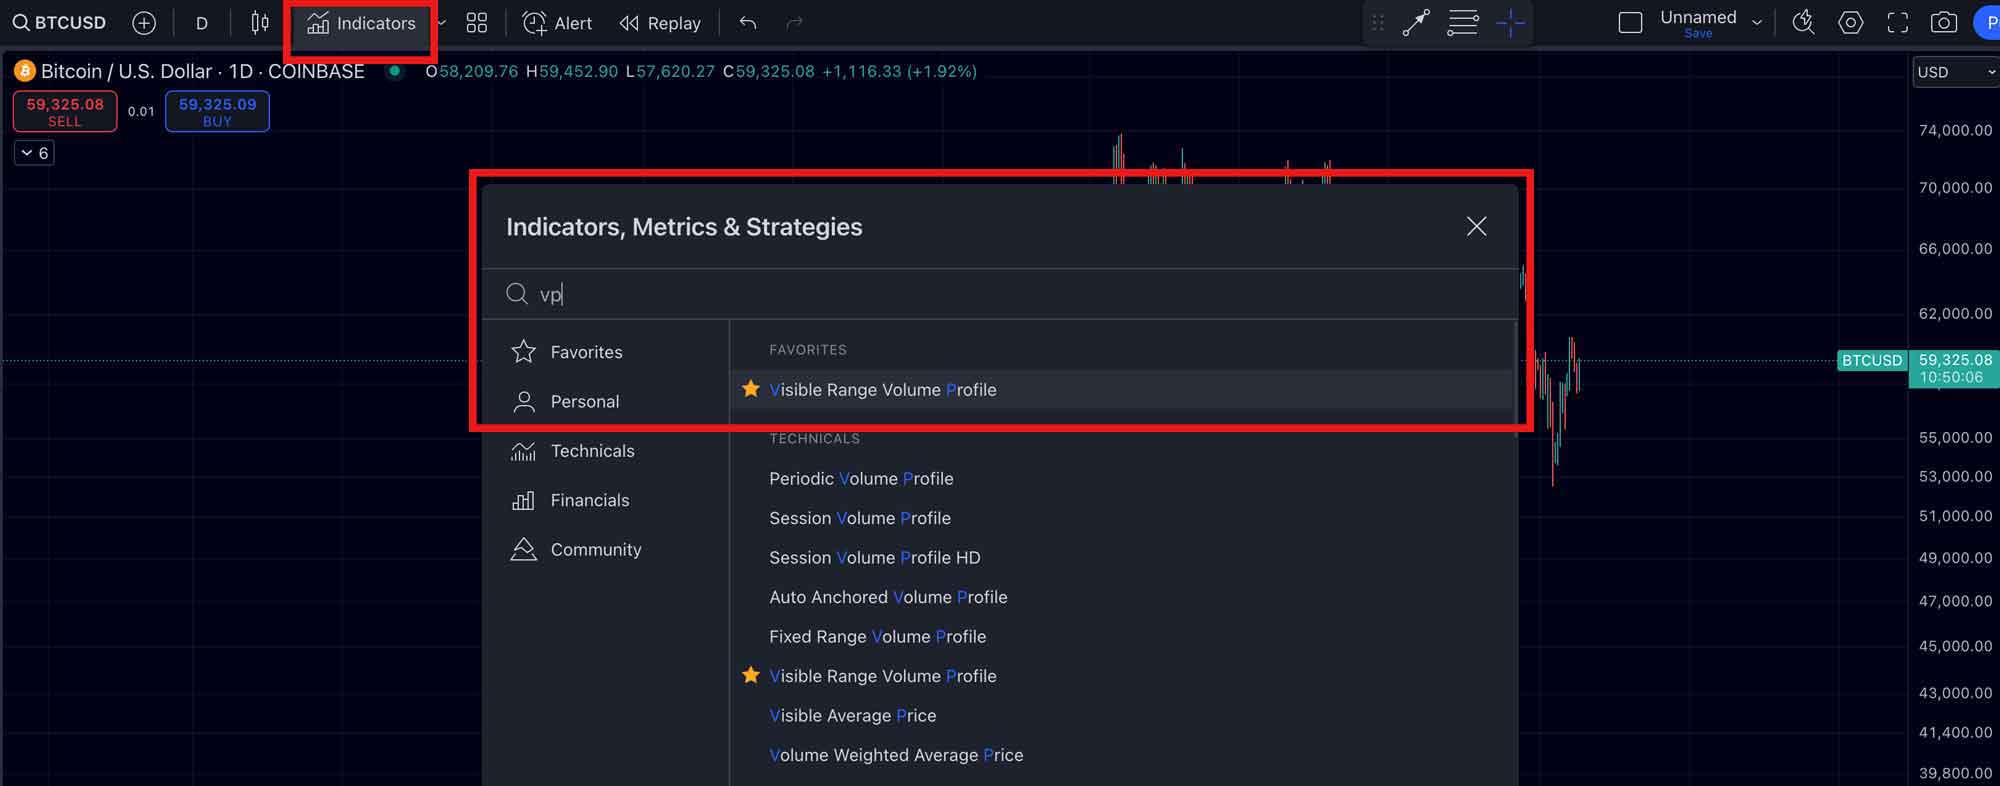
You can find the Visible Profile Volume Range in TradingView. If you don't have an account on TradingView you can create an account here. To open the VPVR indicator, simply click on indicators and type the name of the indicator, once you click it, it will be added to your chart.
Most cryptocurrency exchanges allow their users to freely use this indicator. To access it, head over to your exchange, we’ll use Bybit in this example, head over to the “Trade” section, and choose your crypto of choice. Let’s use bitcoin (BTC).
On the chart that opens, select the “TradingView” option. Under “Indicators,” search for “Volume Profile Visible Range.” Clicking on this option automatically adds the indicator to your chart.
How to read the Volume Profile Visible Range indicator
The information presented by the VPVR indicator can be read to show a multitude of scenarios. Some of the scenarios include:
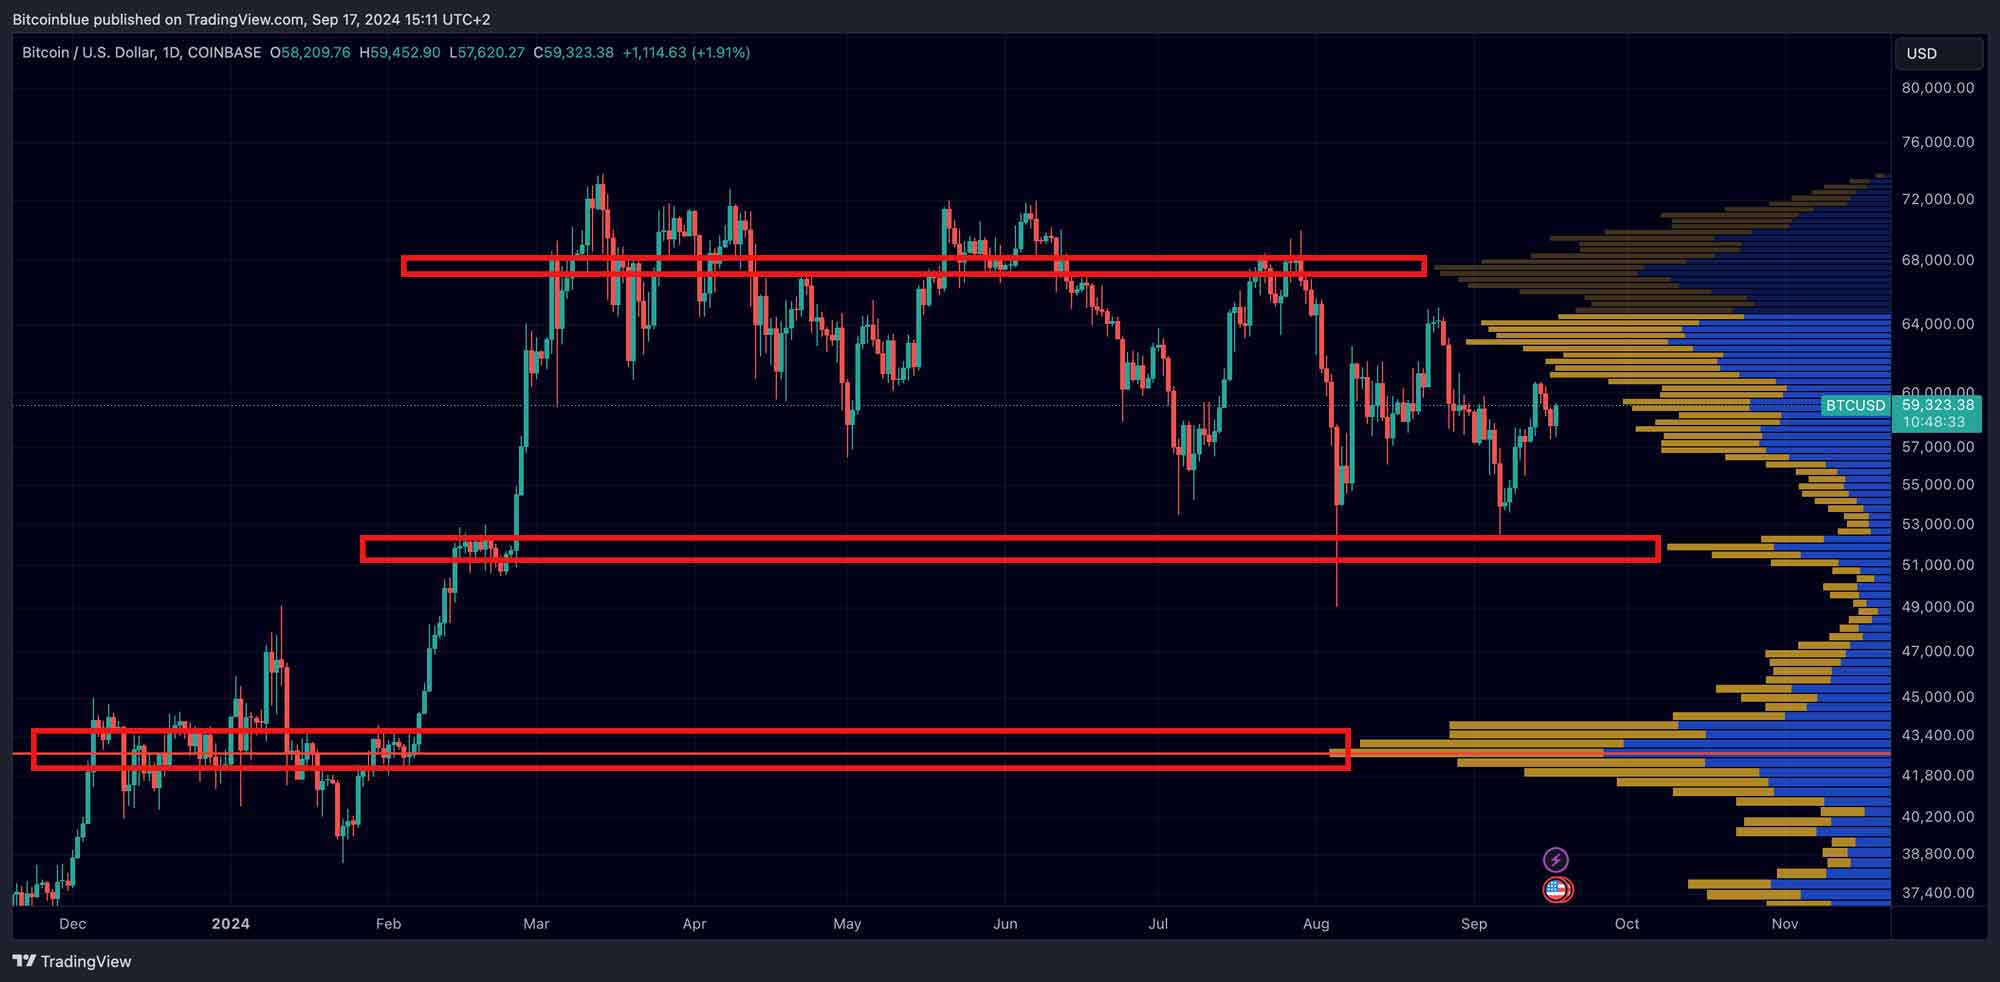
Evaluating support and resistance levels
This can be deduced by looking for the tallest volume bars, These bars show the range where traders were most active enabling you to check whether the price is likely to rise, that is, the bars show a support level, or to drop, meaning that the price has hit a resistance point.
Price rejection
This is shown by short volume bars. Low volumes indicate that trader activity is dropping hinting that the price movement is likely to change course for the worst. This can be seen on the chart where the vertical bars have significant horizontal gaps.
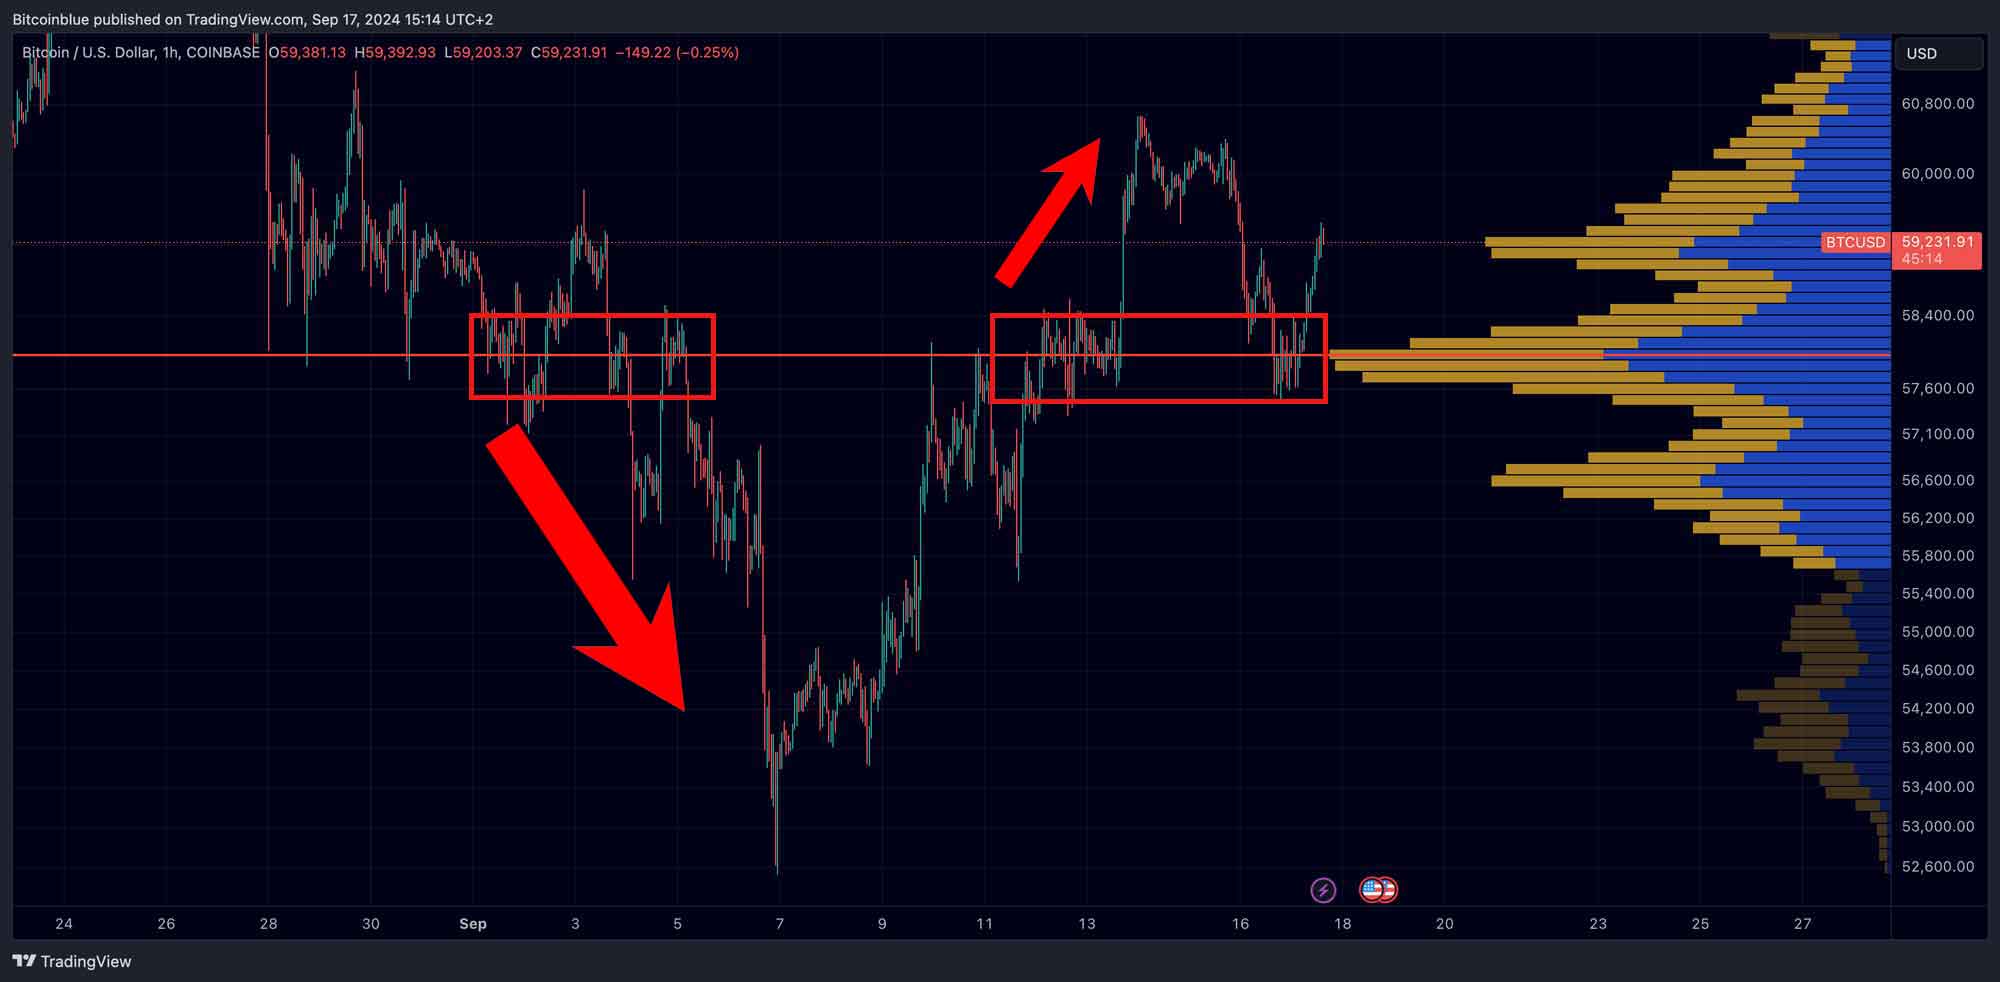
Checking for a breakout
A breakout is a rapid price movement in any direction. To capture this on the chart using the Volume Profile Visible Range indicator, look out for an increase in volume bar that aligns with a breakout candle which is usually formed towards the end of a trend.
Confirming trends
VPVR can also be used to check the validity of either an up or a downtrend. This is indicated by focusing on the indicator’s Point of Control. Candles forming above the POC line show that traders are gearing up to place more trades.
On the other hand, candles forming below this line indicate that traders are leaving the scene hence the onset of a downtrend. Also, when there are more bars below the POC line, within the visible range, it suggests the onset of a bearish sentiment hence a possible price drop while the vice versa showcases a bullish outlook and a likely price appreciation.
Conclusion
The Volume Profile Visible Range indicator is among the most potent technical analysis tools. Whether looking for a trend, breakout, price rejection, or price support and resistance levels, VPVR is a must-have in every crypto trader’s toolbox.
VPVR can be coupled with other indicators like the Taker buy/sell ratio and liquidation heatmaps to further refine a trader's view of the market, something that can help widen the gap between profits and losses.