Williams Alligator Indicator Explained
 Technical trading indicators are like handy tools traders use on price charts to make sense of market data. They help spot trends, gauge momentum, and find potential buy or sell opportunities in a chaotic market. One favourite among trend-followers is the Williams Alligator indicator, created by seasoned trader Bill Williams. It uses three moving average lines, called the Jaw, Teeth, and Lips, to show if a market is trending or just drifting sideways. In this guide, we’ll break down what the Williams Alligator indicator is, how it works, and how you can use it on TradingView for your trading.
What’s the Williams Alligator Indicator?
In short: The Williams Alligator indicator, created by Bill Williams, uses three smoothed moving averages, the 13-period Jaw, 8-period Teeth, and 5-period Lips, to show if a market is trending or moving sideways.
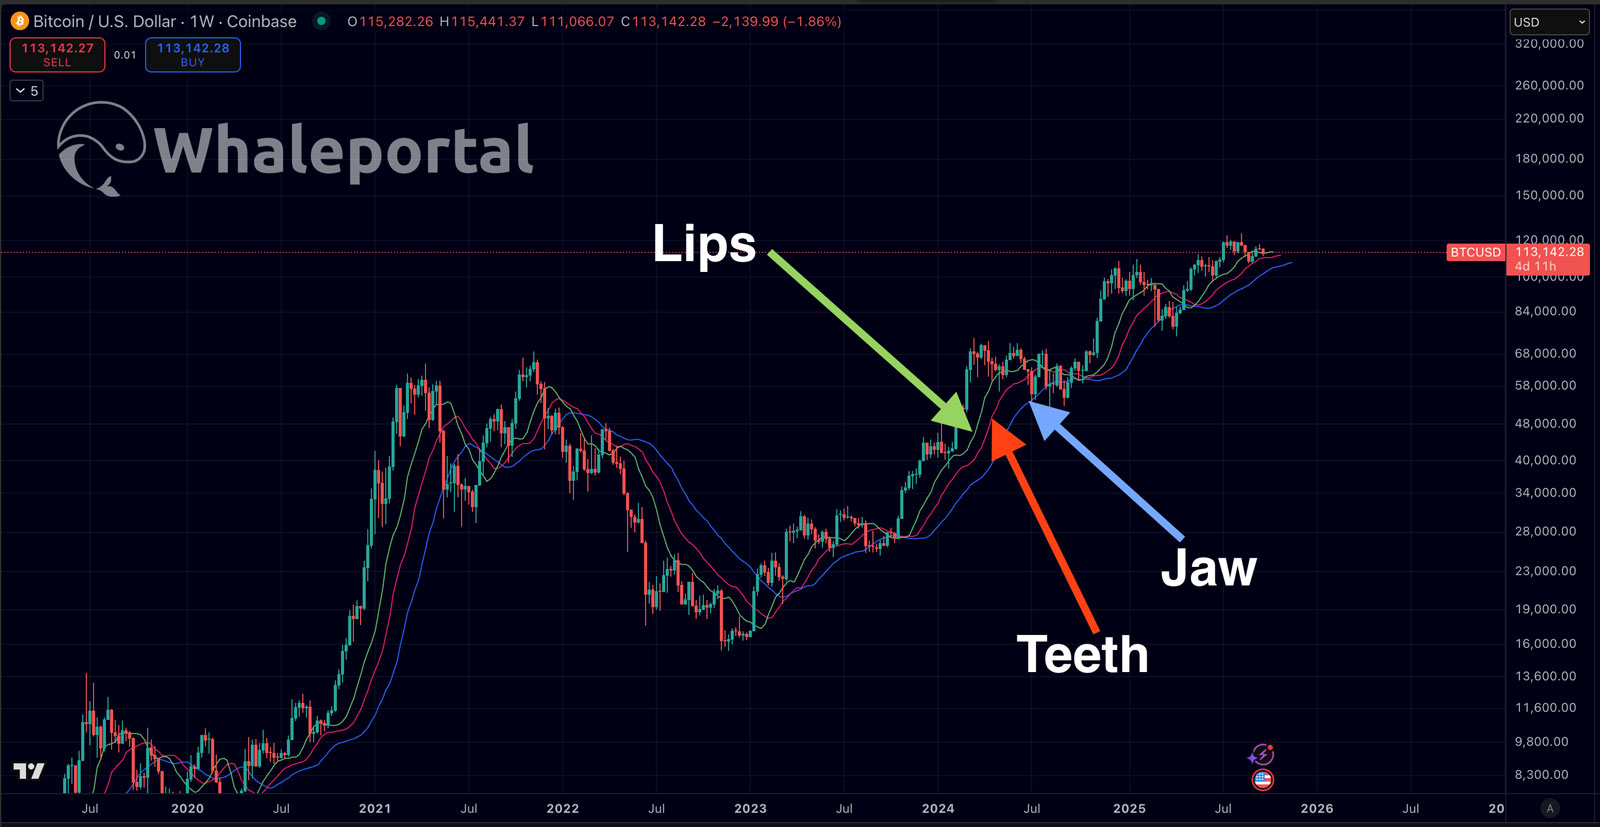
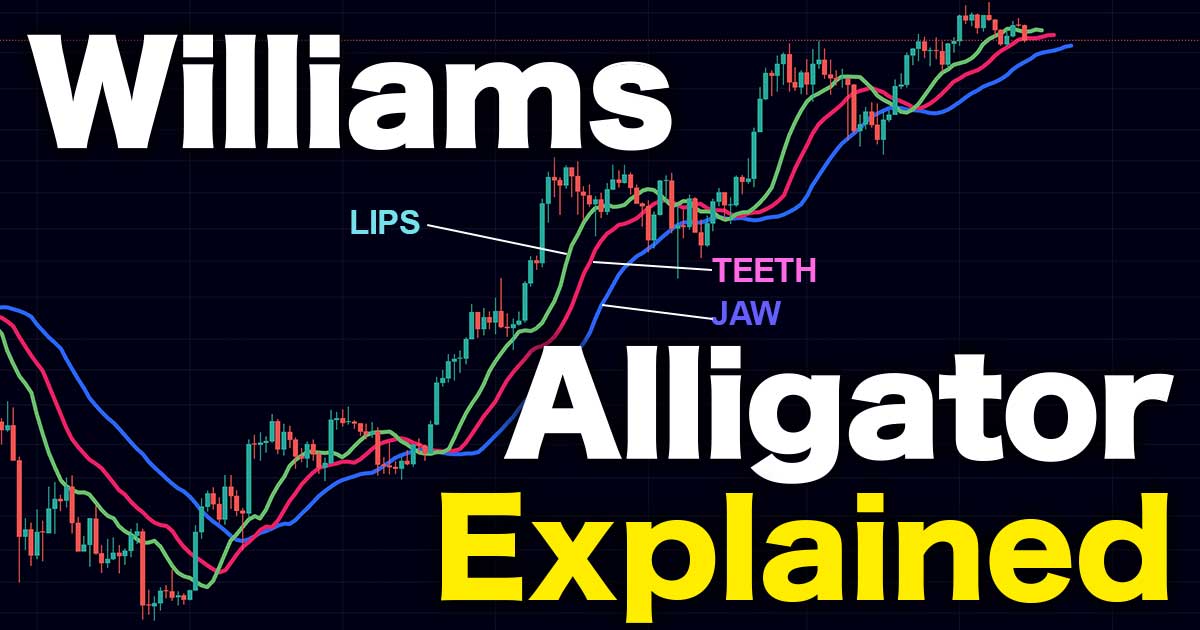
The Williams Alligator is a useful tool traders use to figure out if a market is trending or just bouncing around sideways. It was created by Bill Williams, a well-known trader and author. The name comes from its three lines that act like an alligator’s jaw, teeth, and lips, moving around the price on a chart. Basically, it’s made of three smoothed moving averages set to 5, 8, and 13 periods (numbers tied to the Fibonacci sequence). On a chart, they’re usually color-coded: blue for the Jaw, red for the Teeth, and green for the Lips, so they’re easy to spot.
Bill Williams noticed markets only trend about 15–30% of the time, and the rest, they’re just chilling sideways. The Alligator helps you avoid those boring, choppy times (when the alligator’s “sleeping”) and jump in on the exciting trends (when the alligator’s “awake and eating”). It’s like a visual signal to tell you when the market’s waking up to a trend or going back to sleep.
How the Alligator Indicator Works
The Alligator indicator uses three lines to show market trends. These lines are special moving averages that smooth out price changes and are shifted slightly forward on the chart. Each line represents a different speed and part of the "alligator":
- Jaw (Blue line): The slowest line, showing the long-term trend. It’s a 13-period moving average, shifted 8 bars forward.
- Teeth (Red line): The medium-speed line, showing the mid-term trend. It’s an 8-period moving average, shifted 5 bars forward.
- Lips (Green line): The fastest line, showing the short-term trend. It’s a 5-period moving average, shifted 3 bars forward.
Here’s a simple breakdown:
|
Line colour |
Period |
Shift Forward |
What it shows |
|
Jaw (Blue) |
13 |
8 Bars |
Long-term trend |
|
Teeth (Red) |
8 |
5 Bars |
Mid-term trend |
|
Lips (Green) |
5 |
3 Bars |
Short-term trend |
How the Lines Work Together
The Alligator indicator tells a story about the market:
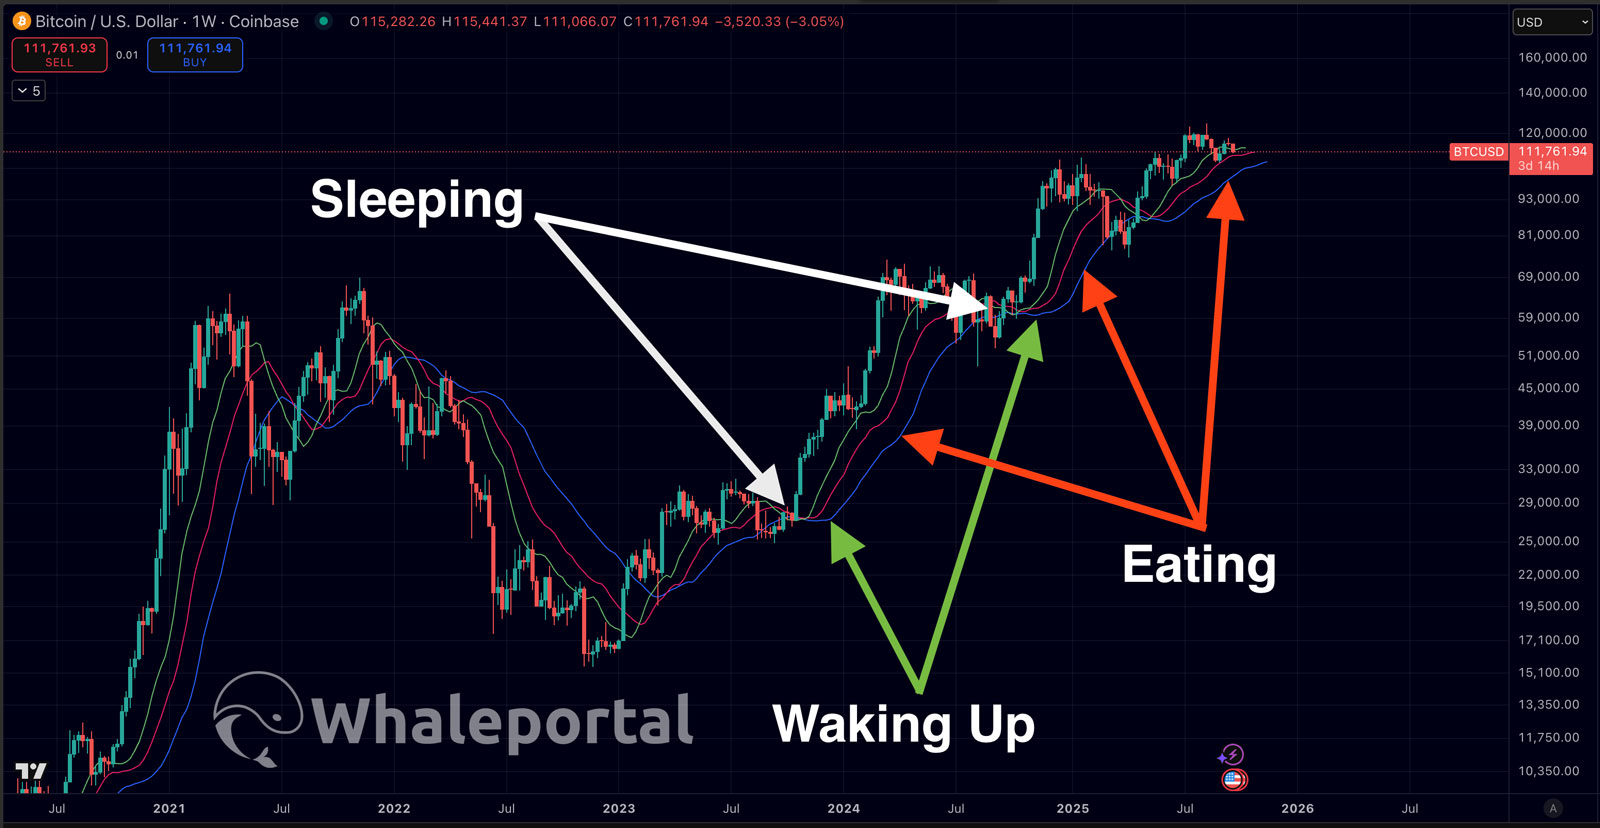
- Lines close together or crossing: The alligator is "sleeping." The market has no clear direction, moving sideways with low activity.
- Lines spreading apart: The alligator is "waking up" and opening its mouth. The green Lips line moves first, crossing above (for an uptrend) or below (for a downtrend) the other lines, signaling a new trend might be starting.
- Lines far apart and aligned: The alligator’s mouth is wide open, "eating." This shows a strong trend. In an uptrend, the green line is on top, red in the middle, blue at the bottom. In a downtrend, it’s blue on top, red in the middle, green at the bottom. Wider lines mean a stronger trend.
- Lines coming back together: The alligator is "full" and ready to sleep. The trend is weakening, and the market may go sideways again. This is often a sign to take profits or wait for a new trend.
This indicator helps traders spot when trends start, grow, or end, making it easier to decide when to trade or wait.
Using the Alligator Indicator on TradingView
The Alligator indicator is easy to add and use on TradingView. Here’s how to set it up:
- Open a Chart: Log into TradingView and choose a chart for the asset you want to analyze (like stocks, forex, or crypto).
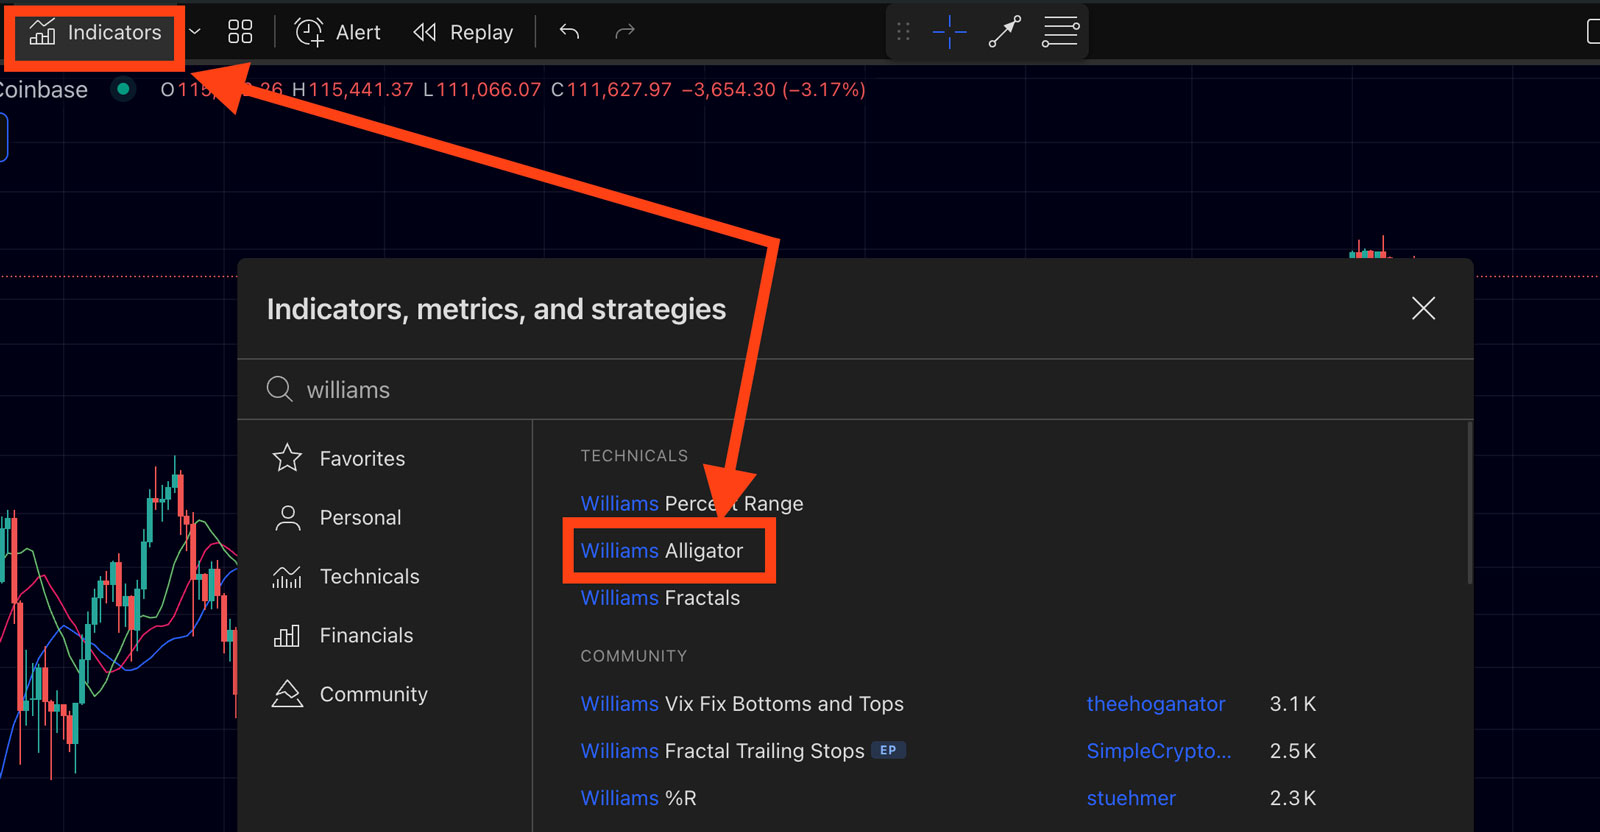
- Go to Indicators: Click the “Indicators” button at the top (it looks like an ƒx symbol).
- Search for Alligator: Type “Williams Alligator” in the search bar. It will appear under “Technicals”.
- Add the Indicator: Click “Williams Alligator” to add it to your chart.
- See the Lines: Three lines will show up: blue (Jaw), red (Teeth), and green (Lips). They may be labeled in the chart legend with their settings (like “Alligator Jaw (13, 8)”).
- Adjust Settings (Optional): The default settings are 13 periods for Jaw (shifted 8 bars), 8 for Teeth (shifted 5 bars), and 5 for Lips (shifted 3 bars). These work well for most cases, so beginners should stick with them. You can change colors or line thickness by double-clicking the indicator or clicking the settings gear icon.
Once added, the three coloured lines will appear over the price chart, ready to help you spot trends.
How to Read Alligator Indicator Signals
The Alligator indicator uses three lines (blue Jaw, red Teeth, green Lips) to show market trends and help you decide when to trade. Here’s how to understand its signals:
- Sleeping Alligator (No Trend): When the blue, red, and green lines are close together or crossing each other, the market is moving sideways with no clear direction. It’s best to wait and avoid big trades, as false signals are common in this choppy phase.
- Alligator Waking Up (Trend Starting): The green Lips line starts to separate and crosses the other lines. In an uptrend, it moves above the red and blue lines; in a downtrend, it moves below them. This shows a possible new trend, but it’s not a strong signal yet. Wait for the lines to spread out or for the price to break past recent highs/lows before trading.
- Alligator Eating (Strong Trend): When the three lines spread apart and move in the same direction, the trend is strong. In an uptrend, the order is green on top, red in the middle, blue on the bottom, all sloping up. In a downtrend, it’s blue on top, red in the middle, green on the bottom, all sloping down. This is a good time to enter a buy (uptrend) or sell (downtrend) trade. The price should stay above the lines in an uptrend or below them in a downtrend. You can use the red or blue lines as guides for setting stop-loss points.
- Alligator Full (Trend Ending): When the green Lips line starts crossing back toward the other lines and they begin to come together, the trend is weakening. This suggests the trend is ending, and the market may go sideways or reverse. If the green line crosses the red line in the opposite direction of the trend (e.g., below it after an uptrend), it’s a sign to take profits and exit. Some traders exit earlier when the lines start narrowing to lock in gains.
By watching these phases, sleeping, waking, eating, and full, the Alligator indicator helps you know when to wait, prepare, trade, or exit based on the market’s trend.
Pros and Cons of the Alligator Indicator
The Williams Alligator indicator has strengths and weaknesses, especially for new traders. Here’s a simple breakdown:
Pros (Advantages):
- Spot Trends Easily: The Alligator shows if the market is trending or flat. When the Jaw, Teeth, and Lips lines spread apart, it signals a trend; when they’re close or crossing, it’s a sideways market.
- Clear Visuals: The colored lines are easy to understand, even for beginners. You can see trends or changes without doing complex math.
- Works for Many Markets: Use it on stocks, forex, crypto, or any timeframe (like daily or hourly charts). The default settings (13, 8, 5) work well for most cases.
- Combines Well: Pair the Alligator with other tools, like Buying and Selling pressure Heatmaps, Funding rates, or Premium Index, to make stronger trading decisions.
Cons (Limitations):
- Lags Behind Price: Since it uses moving averages, the Alligator reacts after price changes happen. You might enter trades late, missing part of the move.
- False Signals in Flat Markets: In choppy, sideways markets, the lines can cross a lot, giving misleading signals that don’t lead to real trends. This can lead to bad trades without extra confirmation.
- Settings May Need Tweaking: The default settings aren’t perfect for every market or timeframe. You might need to adjust them for better results, which takes trial and error. Beginners should stick with defaults at first.
Knowing these strengths and weaknesses helps you use the Alligator wisely and set realistic expectations.
Combining Williams Alligator with Other Indicators
You can combine Williams Alligator with other market metrics and indicators. This can help increase the profitability ratio and reduce noise or false signals. Let’s take the buying and selling pressure heatmap. When the lines of the Alligator are together and the asset is going sideways, preparing for the next trend, you can use the buying and selling pressure heatmaps to already figure out what the most likely direction will be. It can therefore also act as a confirmation when the lines of the Alligator is starting to move apart.
Not only for the directional move but also for when the lines are coming back together, at the end of a move. Is derivatives exchange data confirming this too? Are funding rates extremely high, and the lines are coming back together? This could be an early sign and confirmation of the stalling of a trend. You could even compare it with the Moon Cycles.
These are just a couple of examples of how you can combine the Williams Alligator indicator with other metrics and indicators to increase the accuracy and your understanding of the markets and be a step ahead.
Conclusion
The Williams Alligator indicator is great for new traders to understand market trends. Its three moving average lines (Jaw, Teeth, Lips) show if the market is flat (sleeping) or trending (up or down). This guide covered how the indicator works and how to use it on TradingView. It helps you decide when to avoid trading or when to join a trend, making it a useful tool for beginners.
No indicator, including the Alligator, is perfect. It works best in trending markets and should be used with good risk management and other tools to avoid false signals. Try it on TradingView with a demo account to practice. Watch how the lines move with past price data to learn when the market is sleeping or trending. With practice, you’ll quickly understand the market’s state by looking at the Alligator’s lines. Happy trading, and start with a demo account to build confidence!
Want to trade on a DEX using Williams Alligator? Join Apex Omni and receive 15% Discount on fees!
Related Articles:
- Phemex $30,000 Deposit Bonus Explained
- Bitcoin Moon Cycle Strategy: How Lunar Phases May Predict Price Moves
- Can You Trade on Bybit Without KYC?