How to Track Smart Money on Hyperliquid Using Wallet Data (Complete Guide)
On HyperLiquid, all positions and wallets are public. This is a new shift of transparency that HyperLiquid exchange started and brings a lot of new opportunities to the world of data analysis. You can see which positions are open with which wallets, how much capital those wallets have, and even how good the trackrecord and profits have been from those wallets. This comes along with great opportunities for traders who want to get an insight in these smart money wallets on HyperLiquid. In this article, we’ll explain exactly how you can use HyperLiquid smart money wallet data for your trading. Let’s go!
In short: What is smart money on Hyperliquid?
Smart money on Hyperliquid refers to experienced or high-performing traders whose wallet activity and open positions are publicly visible on-chain, allowing others to analyze their strategies in real time.
What Makes Hyperliquid Wallet Data Unique?
The decentralised spirit in crypto really comes to manifestation here, as everything is transparent. You can literally see the wallets, the capital in the wallets, the open orders, the open positions, and the history of the account. This type of feature we’ve never really seen on other platforms or in traditional finance. Something that might come close is copy-trading, but you’re only able to see the performance of the strategy from the copy-trader, not their whole account, history etc.
So this is definitely something new, and also something that separates HyperLiquid from the rest of the decentralised exchanges, although some are already following this model, like dYdX. So it looks like HyperLiquid is setting the standard.
How to View Open Positions of Other Traders on Hyperliquid
You can view the open positions on the HyperLiquid leaderboard and search by address. However, this is not the best way to view wallets as it is pretty limited and you can not analyse it in real-time. Luckily, some websites have built some tools which we can use to analyse and find the right wallets or bundle them and show the data. The best possible tool that I’ve found is Coinglass HyperLiquid.
Hyperliquid Position Heatmap
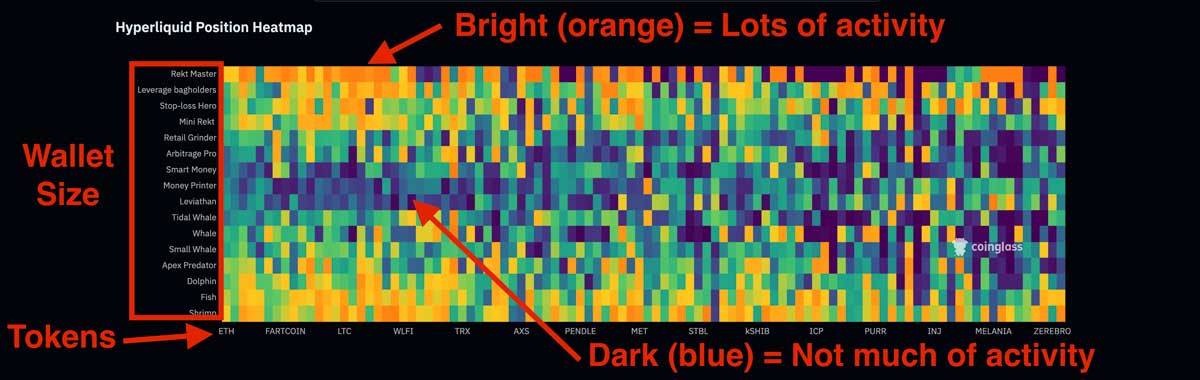
Just like Liquidation heatmaps, buying and selling pressure heatmaps, there is the HyperLiquid Position Heatmap. This heatmap will show which wallet types are active on which trading pairs.
This will give you a quick overview of where the most activity is going on. Is smart money active or is it mostly retail? And on which trading pairs?
In short: How to read the heatmap:
- Dark colors mean low trading activity and few open positions.
- Bright colors (yellow/orange) mean many traders are positioned in that coin.
- Brighter areas show crowded trades, which often come with a higher risk of liquidations.
Hyperliquid Wallet Position Distribution in Real-time
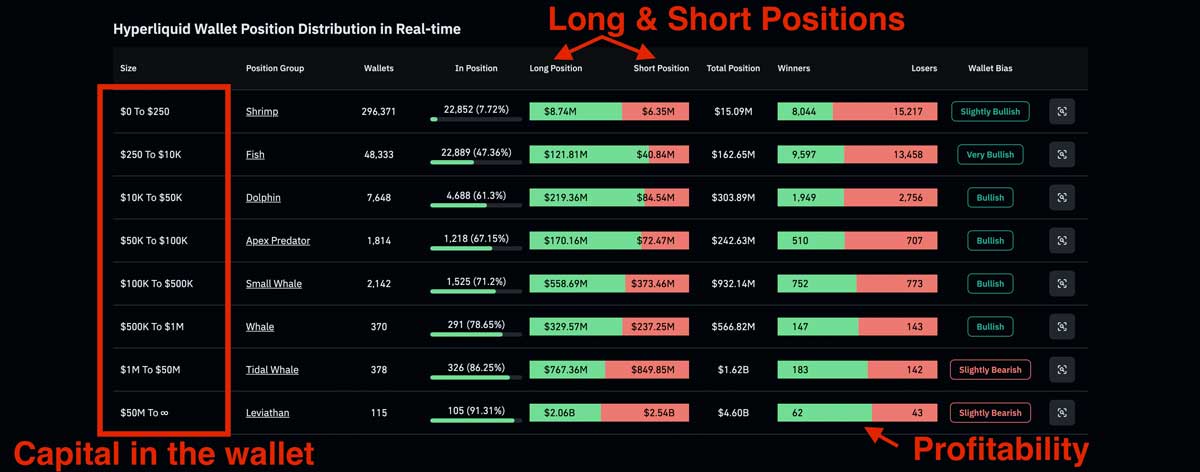
In the HyperLiquid Wallet Position Distribution, you can see the most important metrics. Which wallet types are in which positions, and what is their bias. In the image above, you can clearly see that retail traders are more bullish and that the biggest wallets are leaning more bearish. So there is a big difference in attitude towards the markets from these different types of wallets or traders. What’s also noticeable is that the bigger whales have a higher profitability ratio than the smaller wallets.
Hyperliquid Wallet PNL Distribution in Real Time
You can also view the wallet profit and loss distribution real-time, this can help you verify which wallet types are profiting or losing from the markets.
Wallet Position Distribution shows how traders are currently positioned on Hyperliquid, such as how many wallets are long or short and how large those positions are. Wallet PnL Distribution shows whether those wallets are in profit or loss in real time. In short, position data shows where risk is, while PnL data shows who is winning or under pressure.
|
Chart |
Shows |
Core Insight |
|
Position Distribution |
Open Exposure |
Where risk is exposed |
|
PnL Distribution |
Profit and Loss |
Who is hurting or winning |
How to Identify Smart Money vs Retail Traders
So in the previous examples, you could already see that mostly the bigger wallets are also more profitable. So this is how you can identify smart money. Retail traders, with less capital in their wallets, tend to be more wrong on their trades. This is not biased, but this is visible in the data. That might change in the future; however, my experience is that most of the time, smart money is as well where the big money is. But the good thing is that you can analyse the profitability of these wallets as well, and they both can be valuable.
How to Analyze Individual Wallets on Hyperliquid
Okay, now we’re getting into the detailed and probably most time-consuming part of the hyper liquid wallet analysis, and those are, individual wallets. If you know a wallet address, you can directly paste in into the HyperLiquid wallet finder to see its results. But most likely, you don’t know the exact wallet address and you want to look for some interesting wallets. You can select the wallet types you’d like to analyse by clicking on the search icon. In there, you can see the individual wallet addresses that are in that specific wallet category.
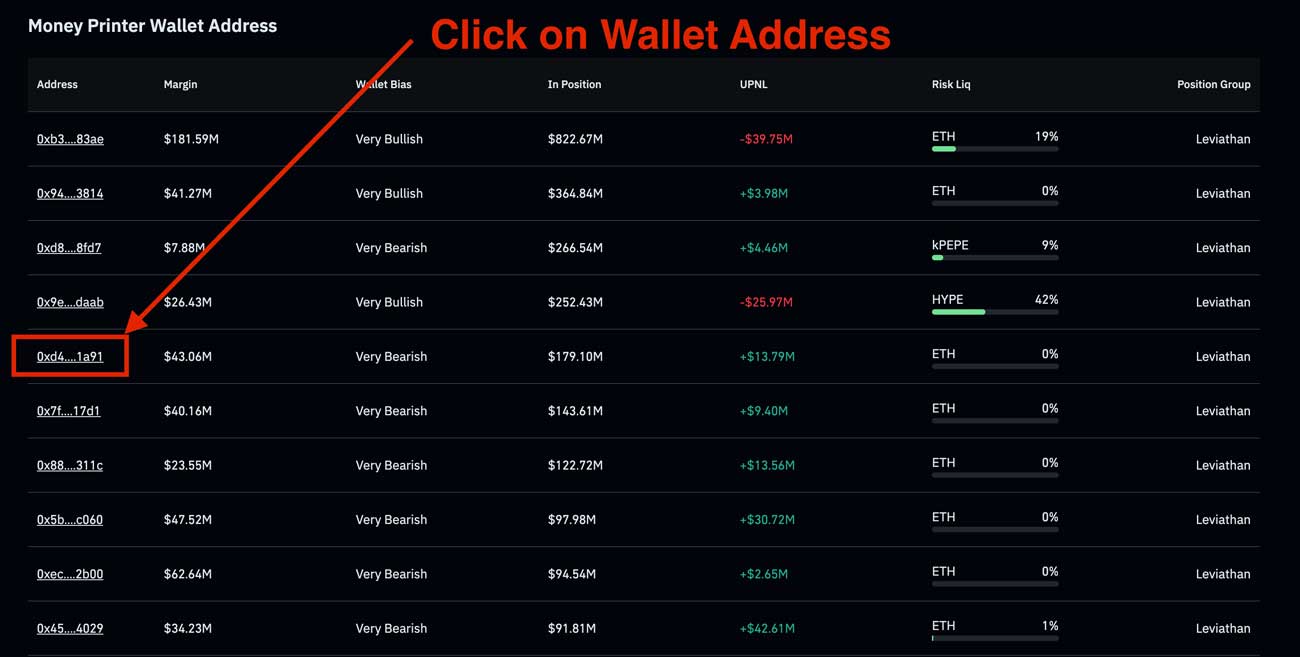
By clicking on the wallet address it will bring you to the individual wallet metrics. Here you can see the total PnL, 24h PnL and basically the complete history of the wallet. This is very important because here you can see the equity curve.
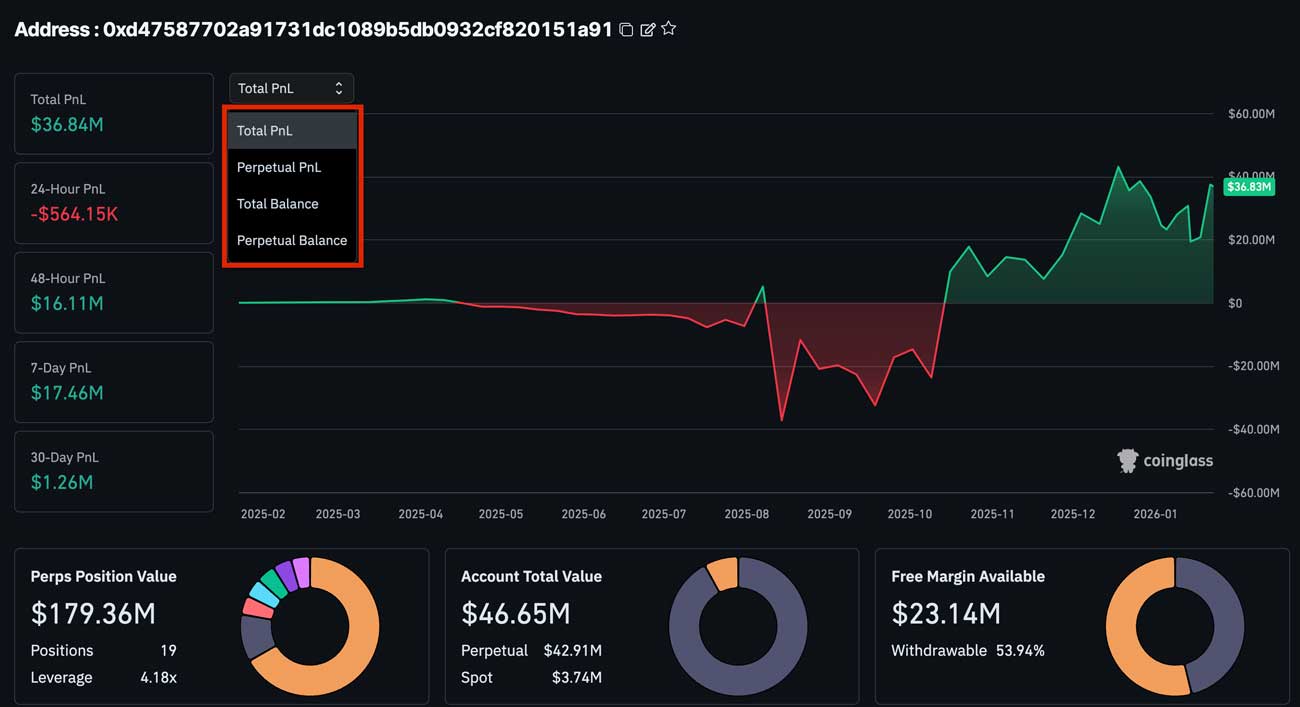
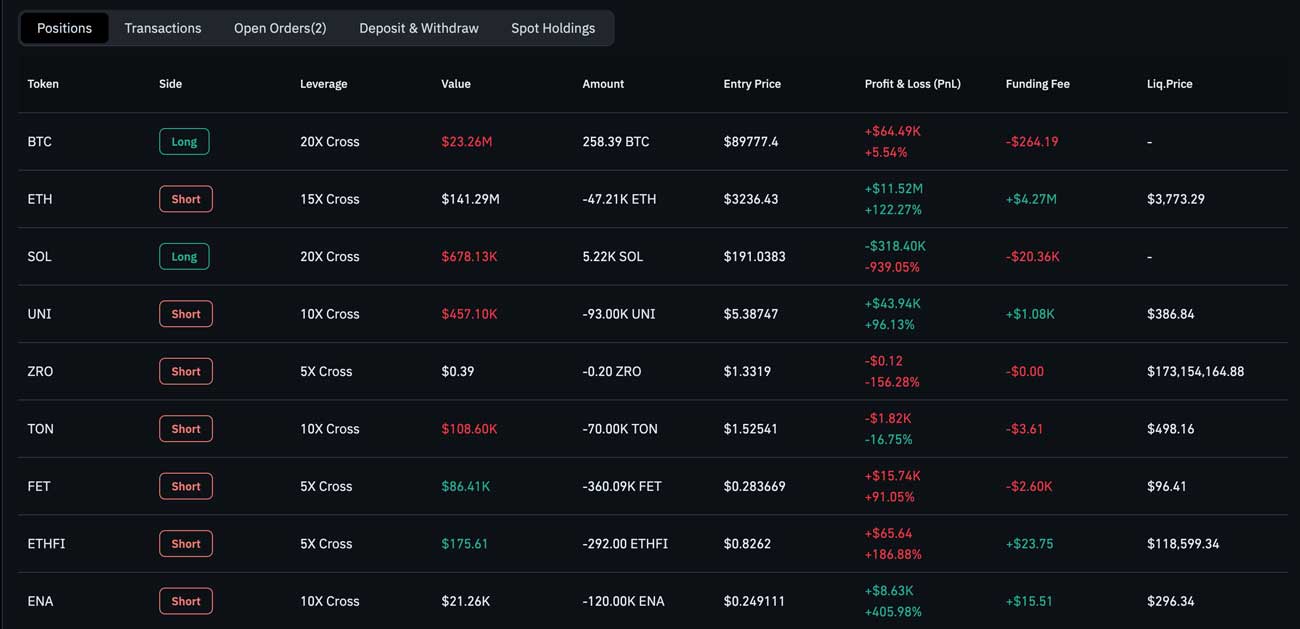
You can select whether you want to view the total PnL or the balance from the wallet. It might be best to view the Perpetual PnL if you analyse the trading strategy of the trader, as other metrics could be skewed due to deposits (e.g. total balance). Below these metrics, you can see all open positions, orders and deposits/withdrawals from this wallet.
Common Mistakes When Copying Whale Wallets
When analyzing wallets on Hyperliquid, many traders make the same mistakes. The data is powerful, but if you interpret it incorrectly, it can lead to bad trades. Below are the most common mistakes to avoid.
Looking Only at Total PnL
A wallet with a high total profit is not always a good wallet to copy.
Some wallets:
- Made one big winning trade
- Took extreme risk to get those profits
- Have very inconsistent results
Always look at how the profits were made, not just the final number.
Ignoring Drawdowns
A wallet can be profitable and still be very risky.
Large drawdowns mean:
- Poor risk management
- High leverage
- Long recovery times after losses
Good wallets protect capital during bad periods, not just make money in good ones.
Copying Wallets That Just Had a Hot Streak
Recent performance can be misleading.
A wallet that performed well recently:
- May just be lucky
- Could be near the end of its strategy cycle
- Often performs worse after being noticed
Always check performance over a longer time period.
Thinking Positions Are Predictions
Seeing smart money long or short does not mean price will move that way.
Wallets can:
- Hedge positions
- Scale in and out
- Already plan exits
Wallet data should be used as market context, not as a buy or sell signal.
Entering Trades Too Late
Just because a wallet is in profit does not mean it is still a good entry.
Often:
- The wallet was entered much earlier
- Risk-to-reward is no longer favorable
- Late entries get stopped out
Timing matters just as much as the wallet itself.
Assuming Retail Wallets Are Always Wrong
Like we’ve seen earlier in the statistics, smaller wallets lose more on average, but that does not mean all retail traders are bad.
Some small wallets:
- Are very disciplined
- Trade consistently
- Manage risk well
Capital size does not always equal skill.
Treating Wallet Copying as Passive
Wallet performance changes over time.
Strategies can stop working because:
- Market conditions change
- Risk behavior shifts
- Psychology changes after wins or losses
Wallets should be monitored and reviewed regularly, not copied forever.
Why Should Traders Use HyperLiquid Data For Their Analysis?
HyperLiquid wallet data gives a unique peek into what is happening in real-time in the markets. It’s an in-depth look into the funding rates, basically. It can clearly help traders to see what the current sentiment is among different market participants. However, you should use this data carefully and don’t follow it blindly. Many traders like to put a lot of trust into others, while they lack the belief in themselves. With trading one of the most important things is to make decisions based on your own perspective and understanding. This will bring conviction into the game and significantly increase the trader's profitability ratio. So the HyperLiquid wallet data can be used to view market sentiment and to get inspiration by looking how others are trading the market, but blindly copying would not be the ay to go in my opinion.
HyperLiquid and the shift to DEX’s
There is a clear trend visible where traders are leaving centralised exchanges for decentralised options. This is mainly because of the regulatory risks with centralised exchanges and the fact that the technology of DEXs has improved os significantly that it feels very similar as to a CEX but with the advantages of a decentralised structure. HyperLiquid is one of the larger decentralized exchanges available today. If you’d like to learn more, read our guide where we compare the best decentralized exchanges.
Conclusion
Hyperliquid offers a unique level of transparency that gives traders valuable insight into real-time market behavior. By analyzing wallet data, positions, and PnL, traders can better understand where smart money is active and how different market participants are positioned.
However, wallet data should be used as a tool for analysis, not as a shortcut. The biggest edge comes from combining this data with your own market understanding, risk management, and timing. When used correctly, Hyperliquid wallet data can improve decision-making, market awareness, and overall trading confidence.
Want to start trading on HyperLiquid? Sign Up using our affiliate link and receive 4% discount on your fees.
FAQ
What is smart money on Hyperliquid?
Smart money on Hyperliquid refers to experienced or consistently profitable traders whose wallets and positions are publicly visible on-chain. By analyzing their positions, PnL, and behavior, traders can gain insight into how more skilled market participants trade.
Can you really see all trader positions on Hyperliquid?
Yes. Hyperliquid is fully transparent. All open positions, orders, and wallet balances are public, which allows traders to analyze market positioning in real time. This is one of the key differences between Hyperliquid and most centralized exchanges.
Is copying wallets on Hyperliquid profitable?
Copying wallets can be useful, but it is not guaranteed to be profitable. Many traders make mistakes by copying too late, ignoring risk, or following wallets during short-term winning streaks. Wallet data works best as market context, not as a direct trading signal.
How do you identify smart money wallets on Hyperliquid?
Smart money wallets are usually identified by:
- Consistent profitability over time
- Controlled drawdowns
- Disciplined position sizing
- Stable equity curves
Large wallet size alone is not enough. Performance consistency and risk management are more important.
What is the best way to use Hyperliquid wallet data for trading?
The best way to use Hyperliquid wallet data is to combine it with your own analysis. Wallet data helps you understand sentiment, positioning, and risk in the market, but trade decisions should always be based on structure, timing, and risk management.
Related Articles:
- Decentralized Exchanges Explained: Which DEX Is the Best?
- HyperLiquid Order Types Explained: A Guide For Beginners
- Best No KYC Crypto Trading App List for Beginners