Hyperliquid Whale Tracker Explained (CoinGlass Guide)
One of the most interesting features of Hyperliquid is that all positions on the exchange are fully transparent. This means traders can see not only general market activity but also the positions of large traders, often referred to as whales. This whale data can be very interesting for traders as their profitability ratio tends to be higher, and sometimes big whales are even capable of moving the market.
A good example of how powerful whale activity can be is when large traders open positions before major market events. In some cases, analysts noticed large trades appearing shortly before important announcements. One well-known example is the Trump insider whale on Hyperliquid, a wallet that opened massive positions before political news events. Whether these trades were coincidental or not, it shows why many traders closely monitor whale activity and large market participants.
To help traders monitor these whales, CoinGlass created the Hyperliquid Whale Tracker, a dashboard that shows whale wallets, positions, and trading activity on Hyperliquid.
In this guide, we’ll explain exactly how the Hyperliquid Whale Tracker works, what each section of the page shows, and how traders can use this information responsibly. It might be a bit overwhelming first, but once you’ve worked through the basics, it’s a unique data set that you can use to analyze the markets.
If you want to start trading on Hyperliquid yourself, you can create an account and receive a 4% trading fee discount using our affiliate link.
What Is the Hyperliquid Whale Tracker?
The Hyperliquid Whale Tracker is a data dashboard that monitors large trading wallets on the Hyperliquid exchange. You can divide the Whale Tracker page into 4 main sections. Let’s have a look at it.
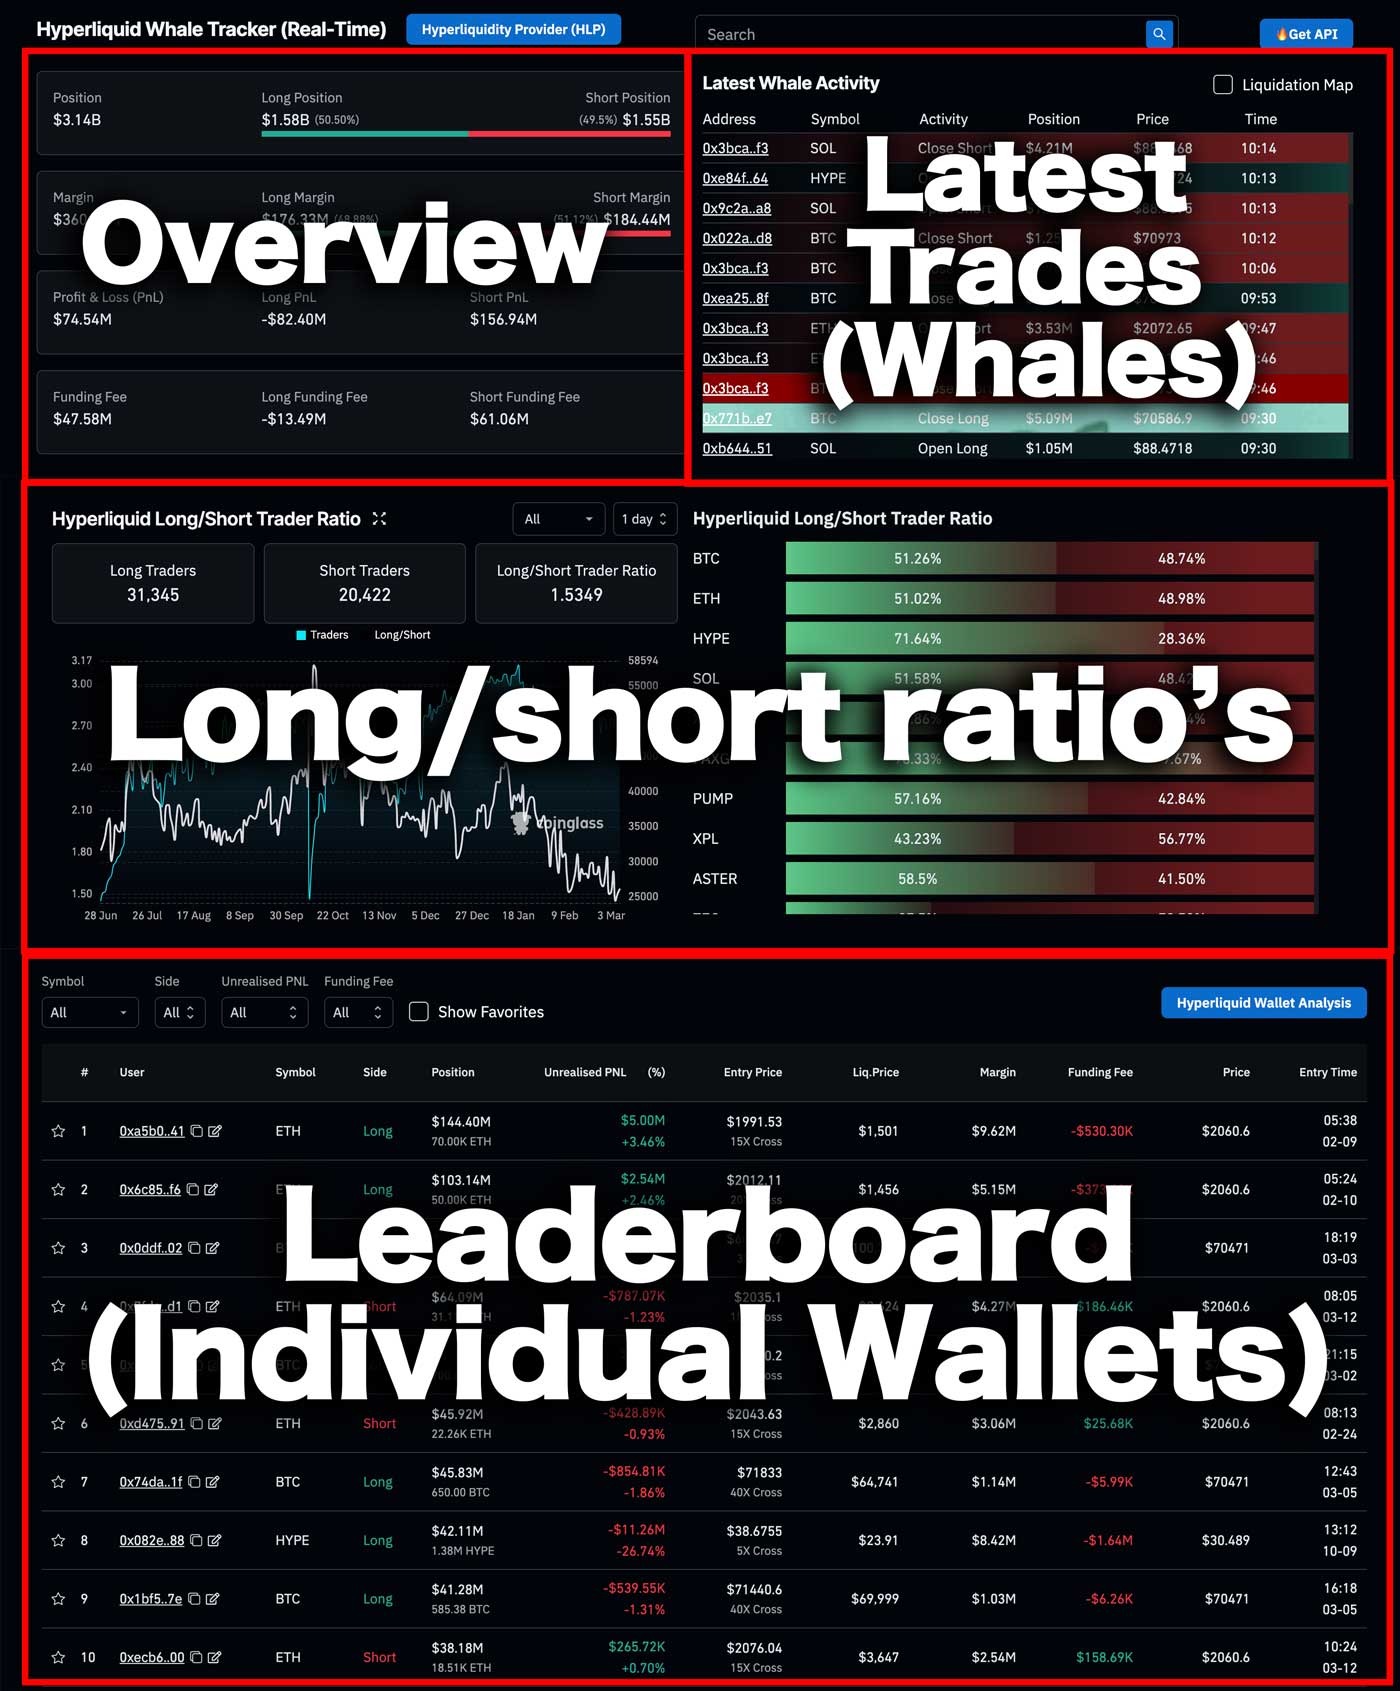
We now have an overview of the available data: total whale positioning (overview), the latest trades, the long/short ratio, and the whale leaderboard. Let’s go through each section step by step. Along the way, we’ll explore where the real value in this data lies and which parts should be interpreted with more caution.
Whale Tracker Overview
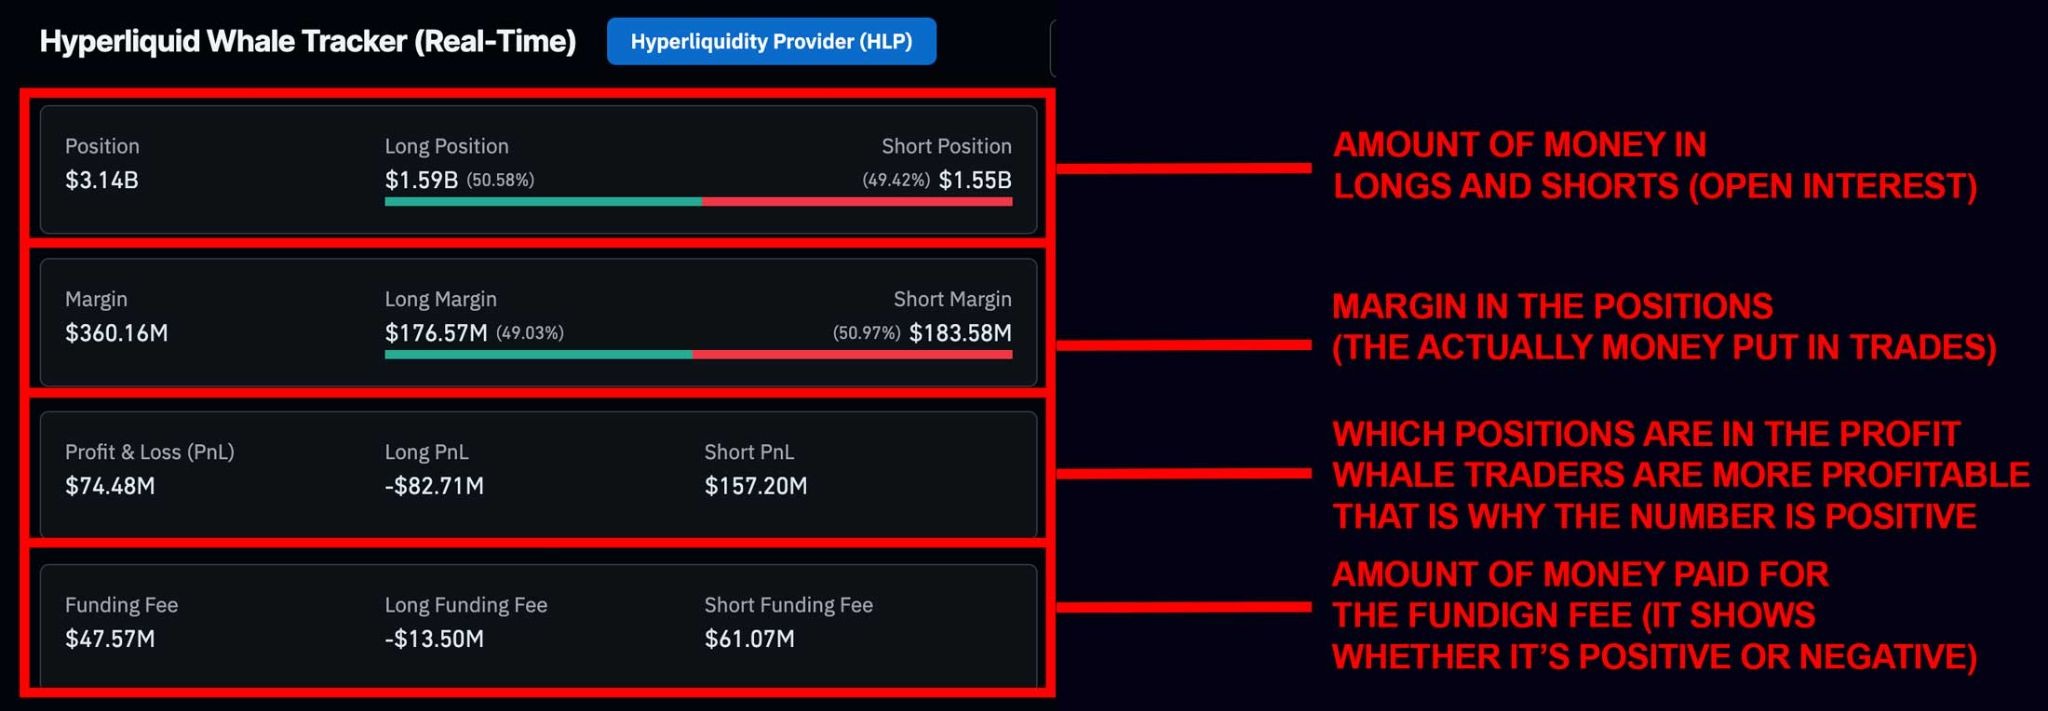
In this overview, you can see the general positions of the biggest whales on Hyperliquid. It shows the total amount of money currently in positions, which is known as open interest, and also the direction the money is betting on: long or short.
You can also see the amount of margin inside these trades. This is the actual money traders have put into their positions. Because traders often use leverage, this margin is multiplied to create the total open interest.
Another thing you can see is how much these positions are in profit or loss. Since these are whale accounts, their profitability is often higher than that of smaller accounts. That is why the total profit and loss number is currently positive.
Finally, you can see the funding fee. This shows how much traders are paying or receiving through the funding mechanism. Funding is an interesting indicator because it can reveal whether the market is more long or short biased. In this dashboard, you see the combined funding fees of the whale positions, which can be different from the funding rate of the entire market.
Latest Whale Activity
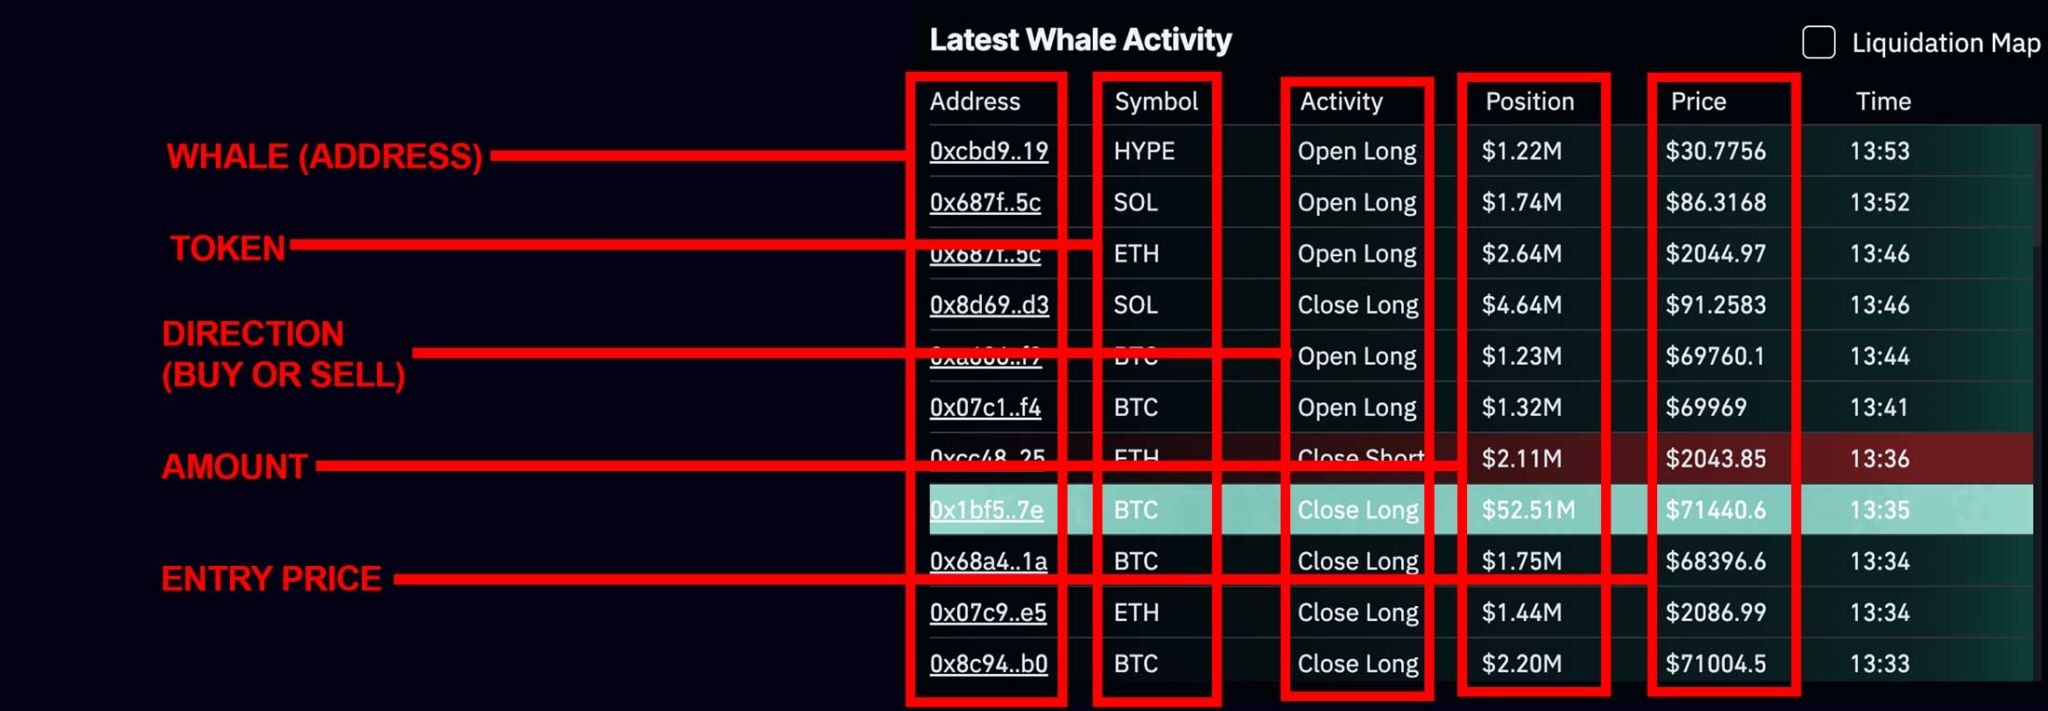
This section shows the latest whale trades across the market. By tracking large positions opened or closed in the last 30 minutes, you can quickly see whether whales are buying or selling and which tokens they are focusing on. This helps you understand the current sentiment of large traders and identify potential market trends.
HyperLiquid Long/Short Trader Ratio
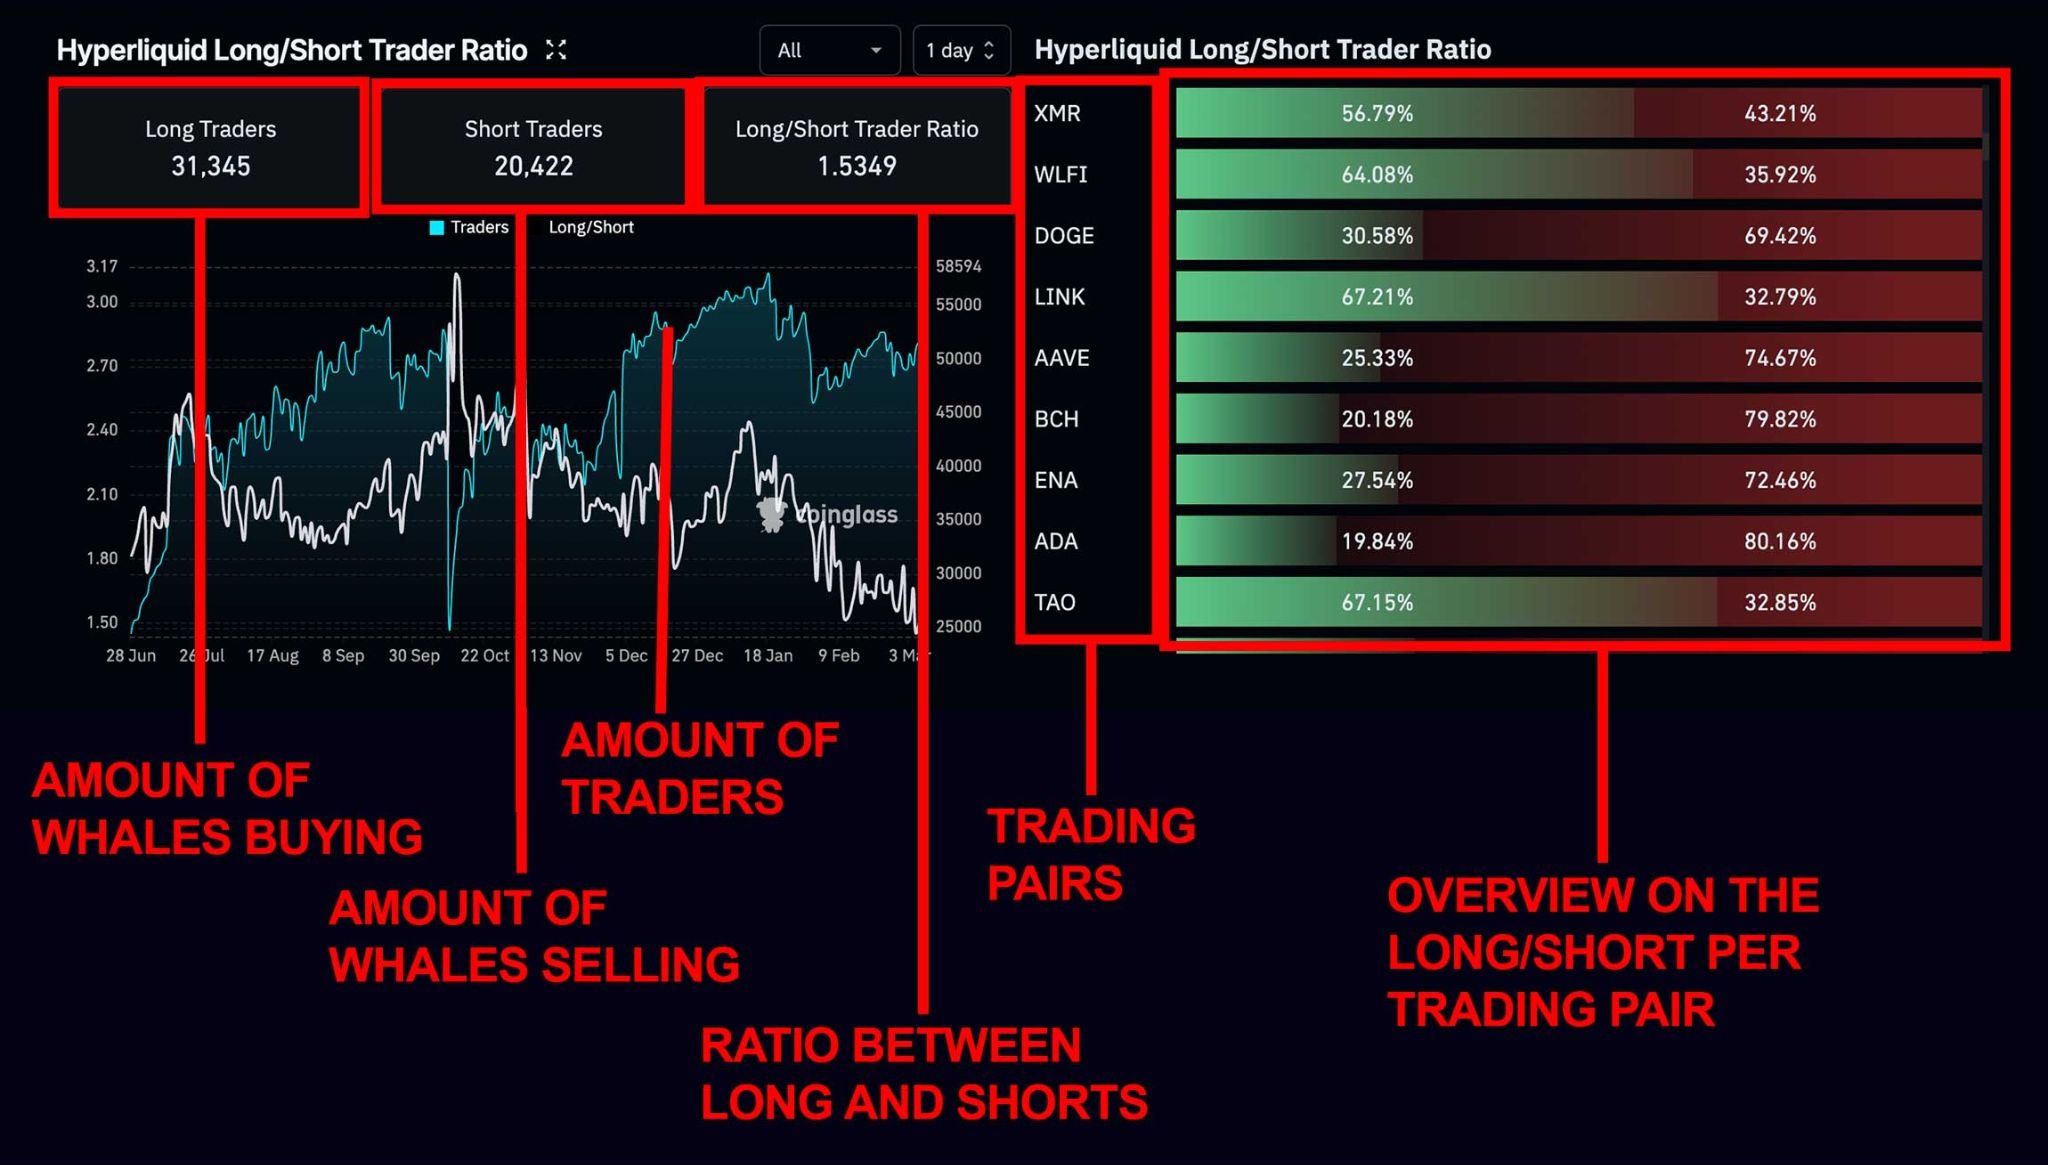
The HyperLiquid long/short ratio gives a good overview on the following things:
- How long or short are whales?
- Did it change in the last period
- How is the ratio divided between various trading pairs
So if we look at the image above we can clearly see that in the last couple of days, a lot of whales have been opening trades and that more shorts have entered the market because the long/short ratio is going down. However, the number of long positions is still higher than the number of short positions, which explains the current long/short ratio. You can also see how this is divided between various trading pairs, this might highlight unique opportunities if a lot of whales are shorting a specific token.
Normally, with exchange data, you want to take a contrarian position or perspective. But with whale data you might actually want to investigate further and take more of a similar position or perspective as it is shown that whale accounts generally tend to be more profitable than smaller wallets, also known as retail money.
HyperLiquid Whale Leaderboard

At the bottom of the page, you can analyze individual positions. Let’s have a look at the data that is presented here.
- Contract address
- Trading pair
- Direction (long or short)
- Unrealized Profit and loss
- Entry price
- Liquidation price
- Margin (actual money in the trade)
- The funding fee that has been paid
- Current price
- The moment of entering the trade
A couple of things are noticeable right here, first of all, that the 2 biggest positions are in a loss. That is why it’s always important to not to blindly copy any wallet as whale can lose too. And sometimes we don’t have the whole story behind a wallet because maybe 1 wallet is created to hedge against other positions. So a specific whale might be up on account 1, but on account 2 has a hedging positions which shows a loss but is part of the trading strategy.
How to use the Hyperliquid Whale Tracker for Trading
You can use the HyperLiquid Whale Tracker for your own trading an analysis in multiple ways. Let’s have a look at them:
Detect sentiment of smart money
Normally we have metrics such as the funding rate, taker buy/sell ratio, fear and greed index and much more. But all of those indicators or usually based on all the market data. In the HyperLiquid Whale Tracker you can actually look at the metrics that are only applicable on the whales, also known as the smart money. This gives a unique peek into the market behavior of the professional side, that does not mean that they’re always right, we’ll get into that further into the article.
Use it as confirmation on own trading ideas
When trading it’s important to always take complete responsibility of every trade that plan. Therefore you can create trading ideas and setups and see in the HyperLiquid Whale Tracker whether smart money is looking in the same direction as you. This can function as an extra layer of confirmation before opening a trade. If the majority of the whales are long for example and you’re looking to long, then that can be an extra confirmation.
Analyze Individual Whale Wallets
In the whale leaderboard, you can analyze individual wallets and study their performance and trading behavior. This allows you to see how large traders manage their positions, which assets they trade, and how profitable they are over time.
If you want to learn more about analyzing whale wallets or potentially copying whale strategies, you can also read our Hyperliquid wallet analysis guide.
Common Mistakes When Using the Whale Wallet Tracker
A common mistake many traders make is assuming that whale wallets are usually right because they tend to be more profitable. However, after researching many different whale wallets, it becomes clear that this is not always the case. Even large traders make mistakes and sometimes lose money. No trader is able to predict the market with 100% accuracy.
For example, if you had blindly copied the Trump Insider Whale, you might have lost money after the wallet became widely known. Since gaining attention, the wallet has experienced several losing trades.
It’s also important to remember that we, as observers, do not always know the full strategy behind a wallet. A whale might use multiple wallets, hedge positions, or move funds between accounts as part of a broader trading strategy.
This is why it’s important not to blindly copy any whale wallet, but instead use whale data as an additional tool to better understand market behavior. Luckily there are some wallets that are under the radar and have been proven profitable in the long run.
HyperLiquid Whale Alerts
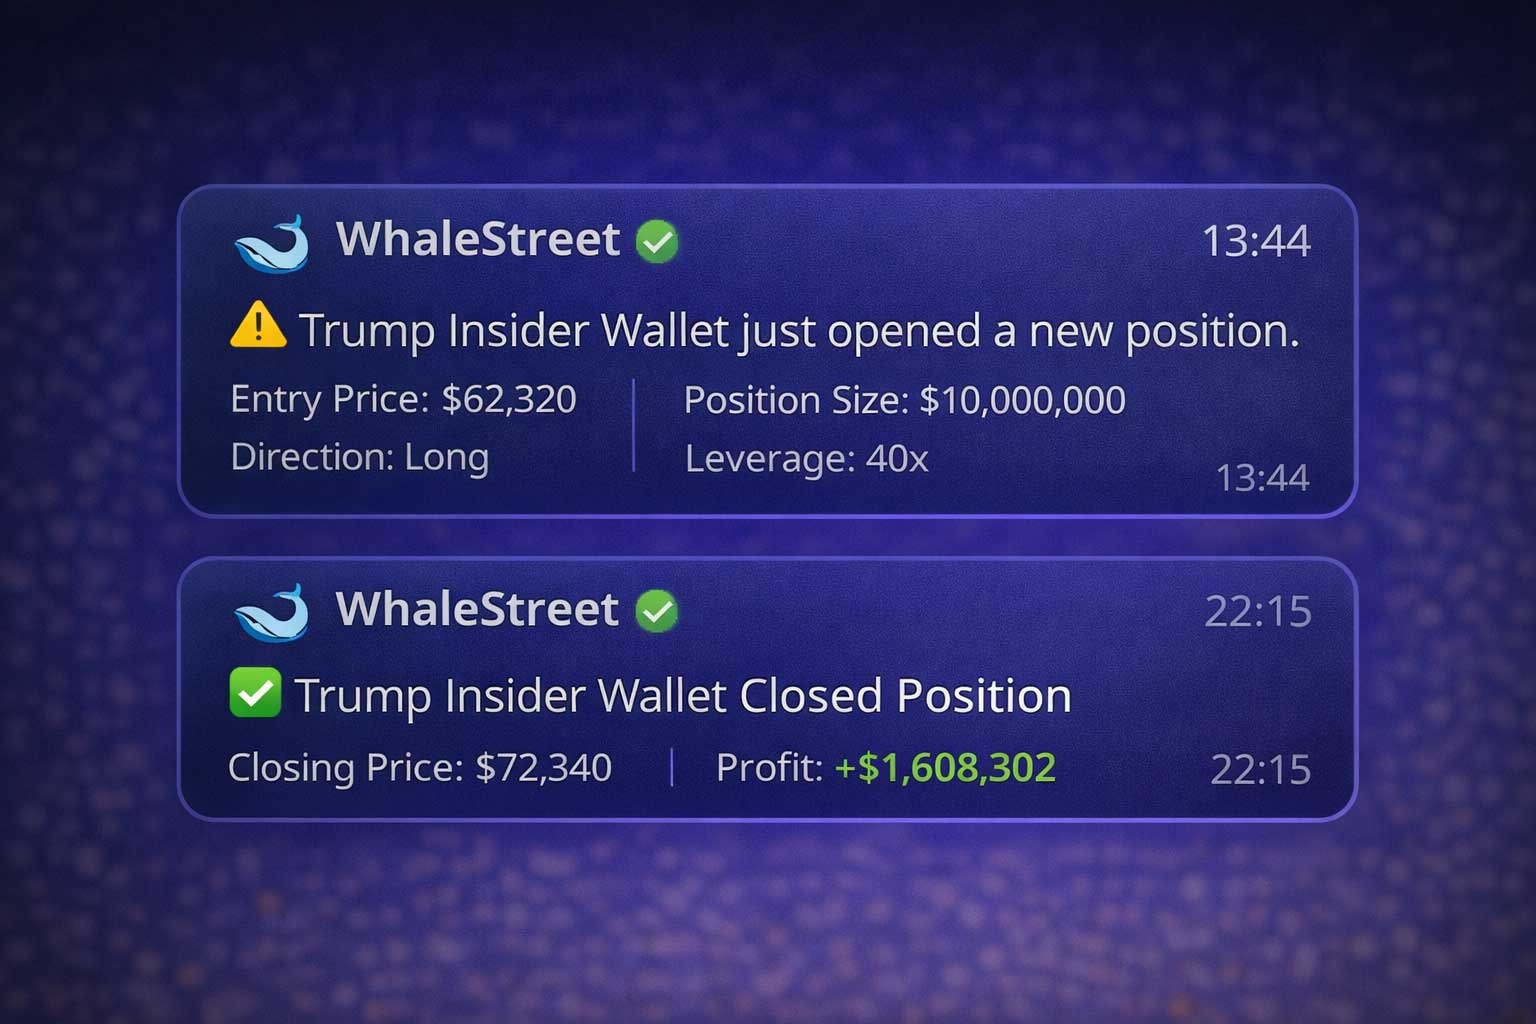
If you’re looking to receive real-time alerts for Hyperliquid whale trades, one of the easiest ways is to join WhaleStreet. This is a free Telegram channel that tracks selected whale wallets on Hyperliquid and sends notifications whenever a whale opens or closes a position, including the key details of the trade.
Conclusion
The Hyperliquid Whale Tracker gives traders a unique look into the behavior of large market participants. By monitoring whale positions, trades, and sentiment, traders can gain valuable insights into how smart money is positioned in the market.
However, whale data should always be used carefully. Large traders can also make mistakes or use complex strategies across multiple wallets. When used responsibly, whale tracking can become a powerful tool for better understanding market dynamics.
If you want to start trading on Hyperliquid yourself, you can create an account and receive a 4% trading fee discount using our affiliate link.
Frequently Asked Questions (FAQ)
What is the Hyperliquid Whale Tracker?
The Hyperliquid Whale Tracker is a data dashboard that allows traders to monitor the positions and trading activity of large wallets on the Hyperliquid exchange. Because Hyperliquid is fully transparent, traders can see whale positions, profits and losses, and recent trading activity in real time.
Why do traders track whale wallets on Hyperliquid?
Many traders track whale wallets because large traders often control significant amounts of capital and can influence market movements. By analyzing whale positions and trading behavior, traders can gain insights into market sentiment and potential trends.
Are whale traders always profitable?
No, whale traders are not always profitable. Although large wallets often have more experience and capital, they can still make mistakes or use complex strategies such as hedging across multiple wallets. That is why whale data should be used as a tool for analysis rather than blindly copying trades.
Can you copy whale trades on Hyperliquid?
It is possible to manually copy whale trades by monitoring wallet activity and opening similar positions. However, this can be risky because traders may not know the full strategy behind a whale’s position, and whales may close or hedge positions quickly.
How can I track Hyperliquid whale trades in real time?
You can monitor whale trades through analytics dashboards such as the Hyperliquid Whale Tracker on CoinGlass. Some traders also use alert services that send notifications whenever large wallets open or close positions, allowing them to follow whale activity more easily.
Related Articles:
- Trump Insider Wallet Explained: The Hyperliquid Whale Betting Millions Before Trump Announcements
- How to Copy HyperLiquid Wallets (Whales, Risks & Smart Strategies)
- How to Track Smart Money on Hyperliquid Using Wallet Data (Complete Guide)