Order Book Depth & Heatmaps Explained: How to Read Crypto Market Liquidity
When trading crypto, understanding market liquidity is key. That's where order book depth and order book heatmaps come in. These tools help traders visualize buy and sell interest and make smarter, faster decisions based on where the market might move next.
If you'd like a visual walkthrough, you can watch the video below. Otherwise, feel free to keep reading as we dive deeper into the topic.
What is order book depth in Trading?
Also known as market depth or depth of market (DOM), order book depth indicates the volume of limit buy and sell orders for a particular asset at various price levels. This metric helps traders understand how much liquidity exists and how many market orders a crypto exchange can absorb before it significantly affects the asset’s price.
For example, if Bitcoin has thick layers of buy orders stacked below the current price, it suggests strong support, meaning price dips may be quickly bought up. On the other hand, thin order books with low volume at multiple price levels mean the asset is more vulnerable to sharp moves caused by relatively small trades.
Understanding order book depth is essential for spotting potential support and resistance zones, estimating slippage when placing large orders, and planning entries and exits more strategically.
Deep vs. Shallow Order Books: Why It Matters
Depth of Market (DOM) is a quick look at how much buying and selling interest there is for a cryptocurrency. It shows the order book in a visual way, so you can easily see how many buy and sell orders are waiting at different price levels.
A deep order book means there are many orders on both sides, buy and sell. This gives the market more stability and makes it easier to place large trades without moving the price too much.
A shallow order book means there are fewer orders. In this case, even a small trade can push the price up or down quickly, which can be risky.
Knowing if the order book is deep or shallow helps you understand how stable the market is and what might happen when you place a trade.
What are order book heatmaps?
Order book heat maps (not to be confused with Liquidation Heatmaps) indicate how liquidity is spread on an order book. It displays the information graphically, allowing traders to refine their trading decisions. An order book heatmap can also be called a liquidity heatmap because it shows traders’ activities across different price points of a particular asset.
Information from an order book heatmap can show things like the time of increased trading activity, which may help evaluate an asset’s support and resistance points.
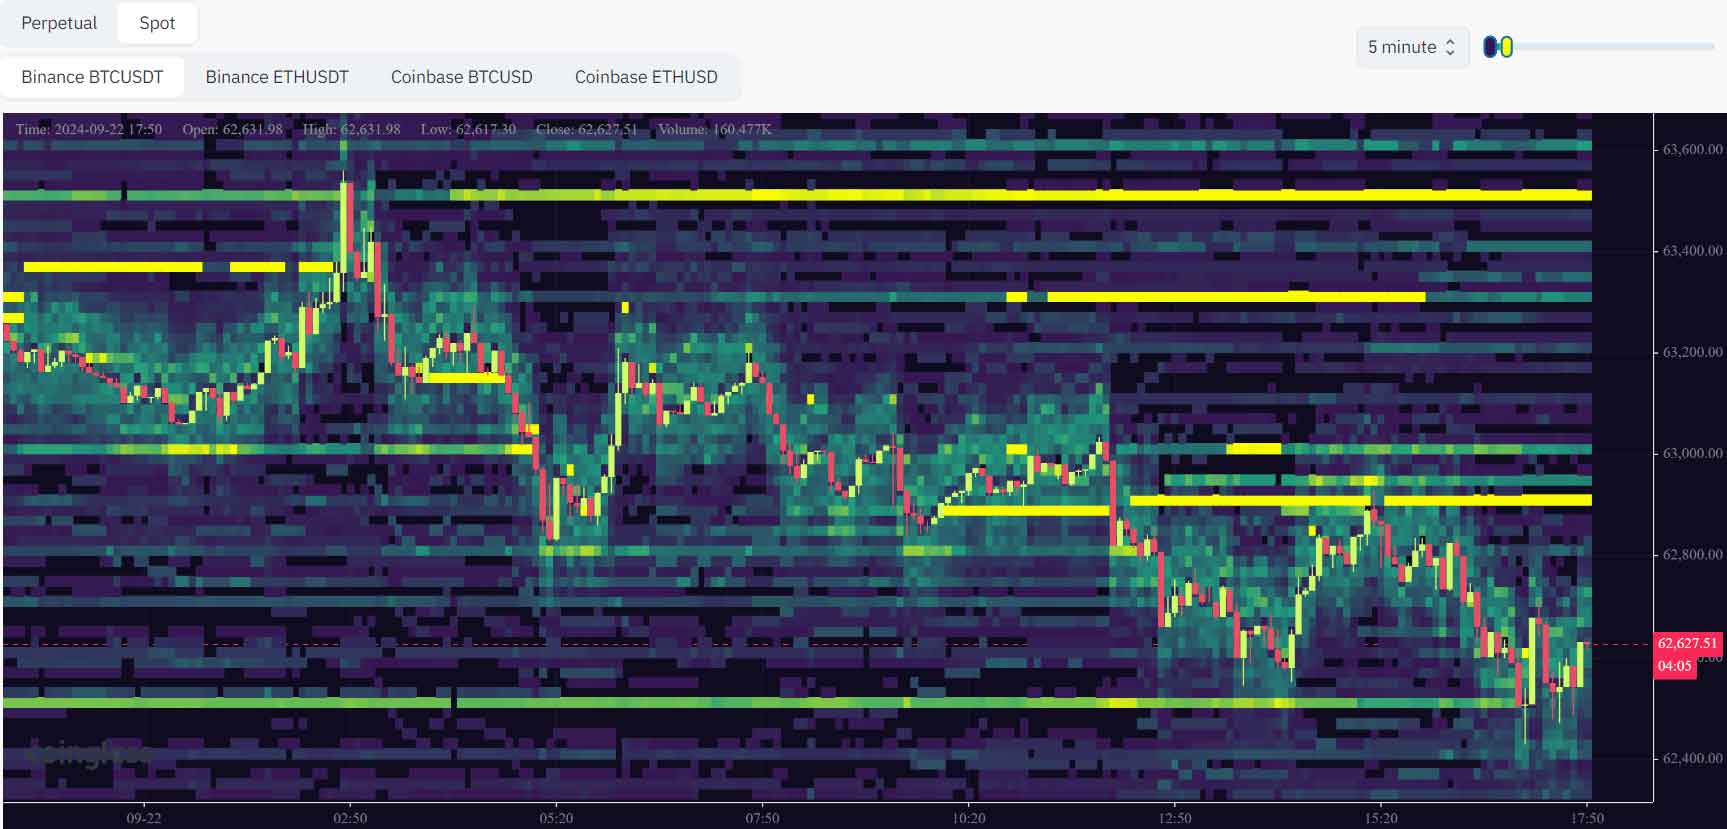
A liquidity heatmap (not to confuse with Liquidation heatmaps) comprises a grid of blocks with each block having a distinctive color. The colors represent the volume with bright colors showing more traded volume than dark colors. A heatmap also has an intensity slider to help users select the type of volumes they want to be displayed.
How order book depth and order book heatmaps can work together
An order book is made up of multiple components like price levels and order quantities and shows therefore the market depth. With the volatile nature of cryptocurrencies, deciphering these components can take valuable time that a trader needs to make a decision.
Although order book depth shows the concentration of trade volumes at different price points, it doesn’t paint a clear picture of the true state of the market.
Order book heatmaps put together information provided by the order book and visualize it into a heatmap. This gives traders all the information about an asset’s liquidity and real-time traders’ interest in a single view. It just shows where traders are planning to buy and sell and with which quantities.
Order book depth coupled with an order book heatmaps can help a trader make more profitable trades by knowing how to price their orders and also use the information to discern whether an asset’s price is bound to increase, drop, or enter a range.
The two can be combined with indicators like the Volume Profile Visible Range (VPVR) and Taker buy/sell ratio to fuel trading strategies like grid trading.
Final words
Order book depth and heatmaps together give a powerful visual overview of market liquidity. By understanding where large orders are clustered, traders can better anticipate price moves, adjust their entries, and manage risk.
Want more visual trading tools? Explore sentiment heatmaps and buying/selling pressure overlays to upgrade your strategy.
Frequently Asked Questions
What is order book depth in crypto trading?
Order book depth shows how many buy and sell limit orders exist at different price levels for a cryptocurrency. It helps traders understand how much liquidity is available before the price is affected.
What’s the difference between a deep and a shallow order book?
A deep order book has many orders and can handle large trades without moving the price much. A shallow order book has fewer orders, so even small trades can cause big price changes.
What is the purpose of an order book heatmap?
An order book heatmap shows where large buy and sell orders are placed, using colors to highlight high and low liquidity areas. It helps traders quickly see where other market participants are planning to act.
How are order book depth and heatmaps used together?
Depth shows the numbers, while heatmaps turn those numbers into visuals. Used together, they help traders make faster and more informed decisions about where to place their own trades.
Are order book heatmaps the same as liquidation heatmaps?
No, they are different. Order book heatmaps show where orders are sitting in the book. Liquidation heatmaps show where traders might get liquidated based on their open positions and leverage.
Related Articles:
- Liquidation Heatmaps Explained
- Crypto Vaults Explained
- Quantified Market Sentiment