The Best Buy and Sell Indicators for Crypto
Cryptocurrency trading can feel like surfing giant waves – thrilling, but fraught with risks. The market's volatility can be intimidating, but with the right tools, you can make informed decisions and capitalize on opportunities. In this article, we will explore some of the most reliable traditional indicators for buy and sell signals and introduce you to a revolutionary, holistic approach using Whaleportal charts that can help you master the crypto market.
Traditional Indicators for Buy and Sell Signals
Before we dive into the game-changer, let’s review some traditional indicators that have stood the test of time.
Moving Averages (MA)
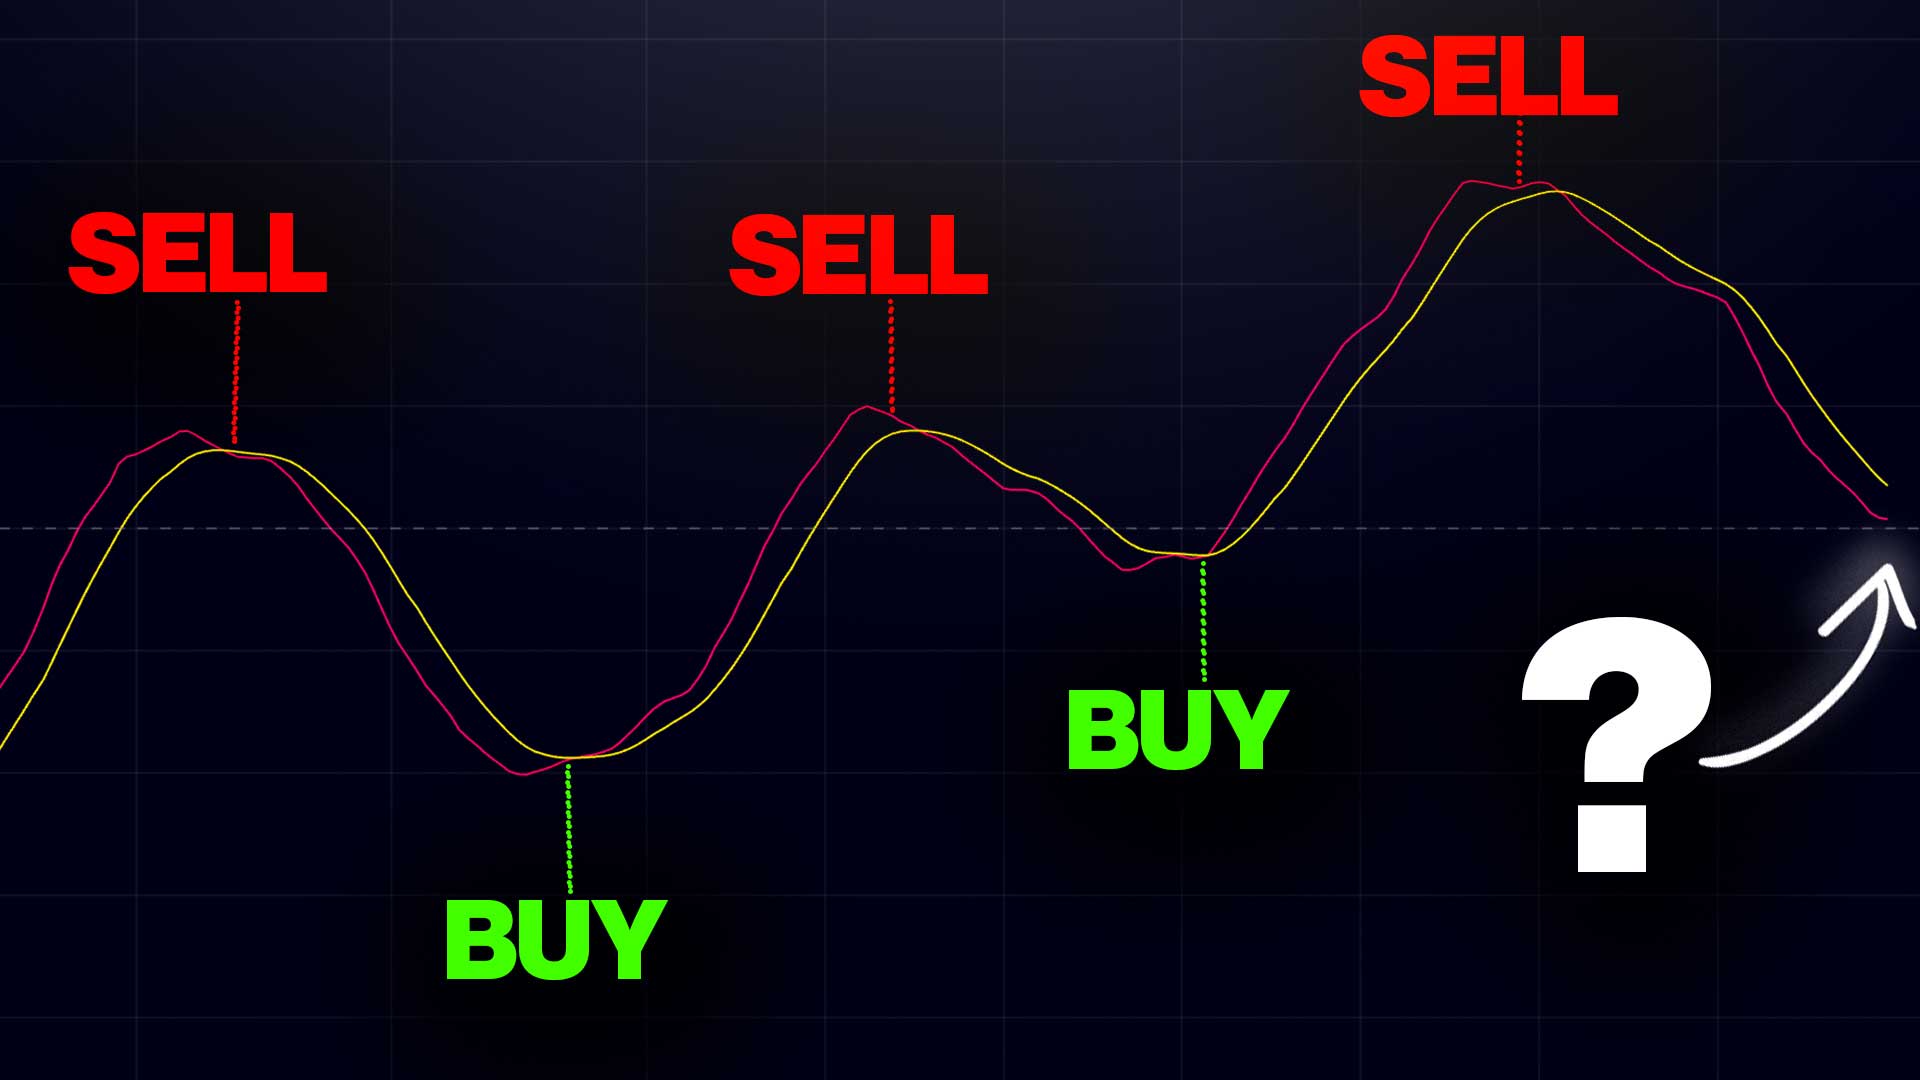
Moving Averages (MAs) are essential tools for identifying market trends by smoothing out price data over a specific period. The Simple Moving Average (SMA) and the Exponential Moving Average (EMA) are the most commonly used types.
- Buy Signal: When the price crosses above the moving average.
- Sell Signal: When the price crosses below the moving average.
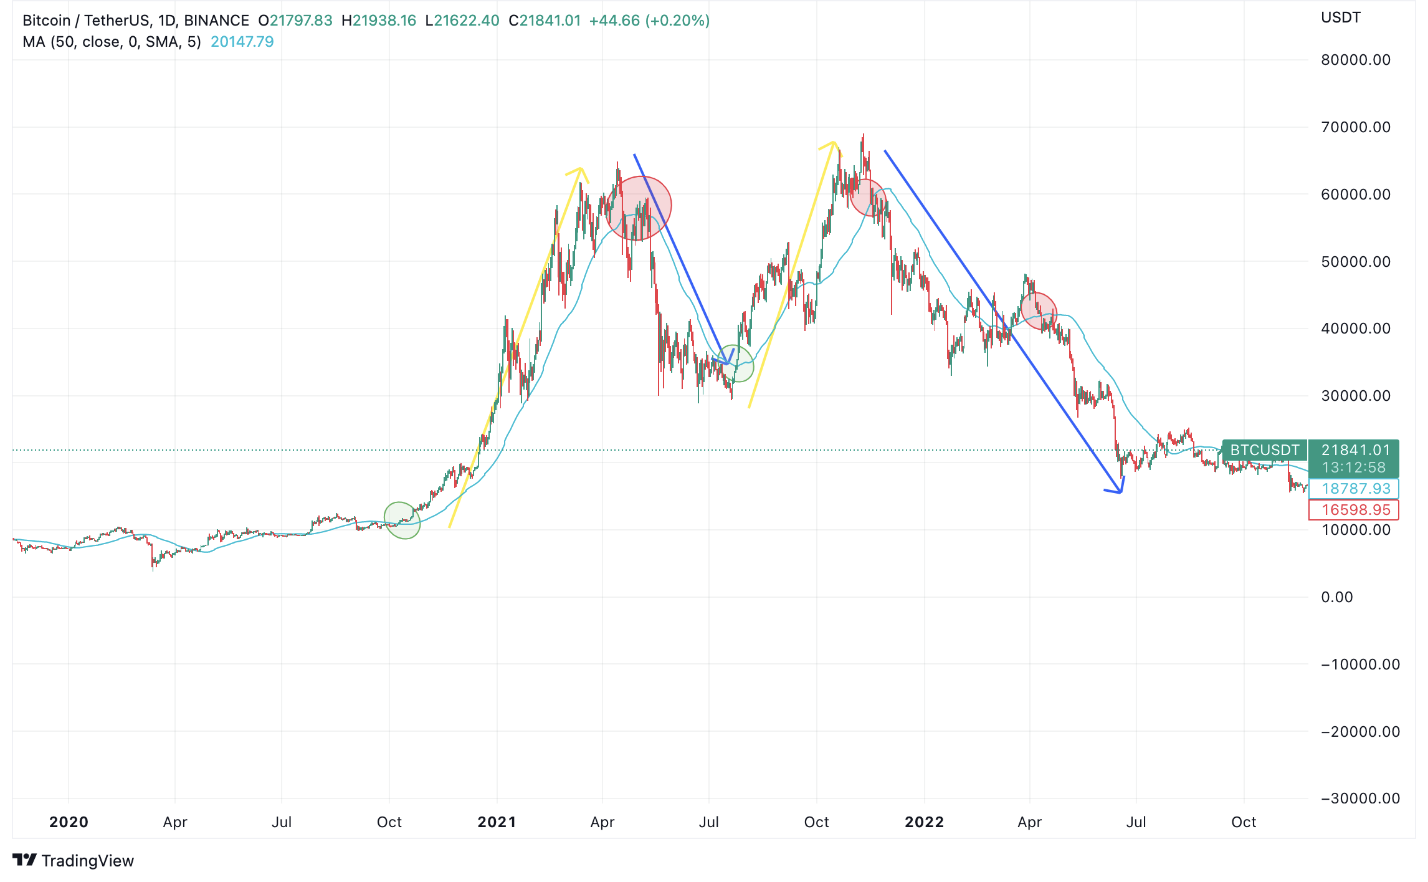 Figure showing Simple Moving Average of 50 applied on a daily time frame chart
The Moving Average is like the ocean’s tide, slowly revealing the broader trend. When the price floats above the MA, it’s like catching a wave – a signal to ride upward momentum. Conversely, when the price dips below, it's a cue to brace for a downturn.
Moving Average Convergence Divergence (MACD)
The MACD is a powerful momentum indicator that shows the relationship between two moving averages of a security’s price. It comprises the MACD line, the signal line, and the histogram.
- Buy Signal: When the MACD line crosses above the signal line.
- Sell Signal: When the MACD line crosses below the signal line.
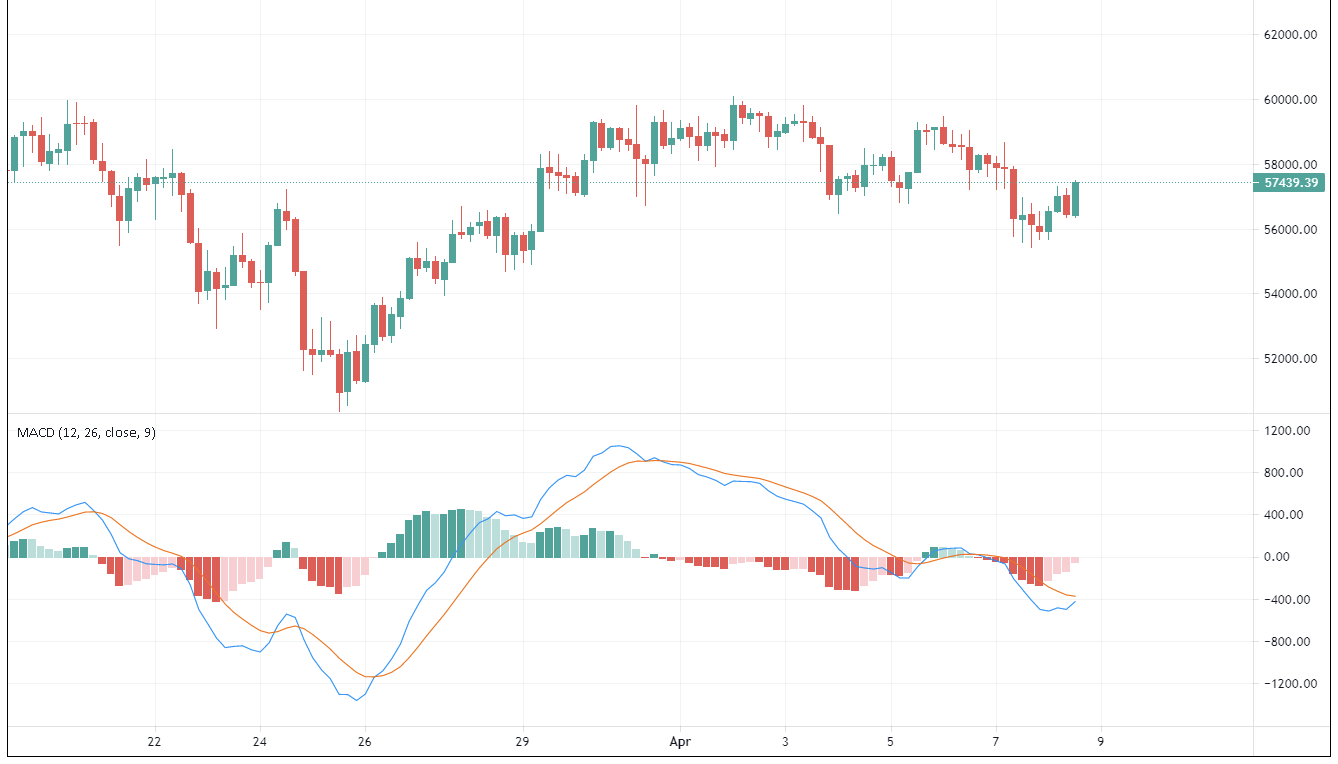 Figure showing MCAD 4hr chart for BTC/USD
Think of the MACD as a compass guiding you through the stormy seas. When the MACD line sails above the signal line, it points to a favorable wind for buying. Conversely, when it dives below, it warns of rough waters ahead, signaling a sell.
Candlestick Patterns
Candlestick patterns provide visual insights into price movements and market sentiment. Popular patterns include the Doji, Hammer, and Engulfing patterns.
- Buy Signal: A Hammer at the bottom of a downtrend can signal a potential reversal.
- Sell Signal: An Engulfing pattern at the top of an uptrend can indicate a bearish reversal.
 Examples of common candlestick patterns
Candlestick patterns are like the weather forecasts of trading, providing snapshots of market sentiment. A Hammer at the bottom of a trend is like a sunny break after a storm, indicating potential for a market rebound. An Engulfing pattern at the top is a dark cloud on the horizon, signaling possible decline.
Relative Strength Index (RSI)
The RSI measures the speed and change of price movements, between 0 and 100. It helps identify overbought or oversold conditions.
- Buy Signal: When the RSI falls below 30, indicating an oversold condition.
- Sell Signal: When the RSI rises above 70, indicating an overbought condition.
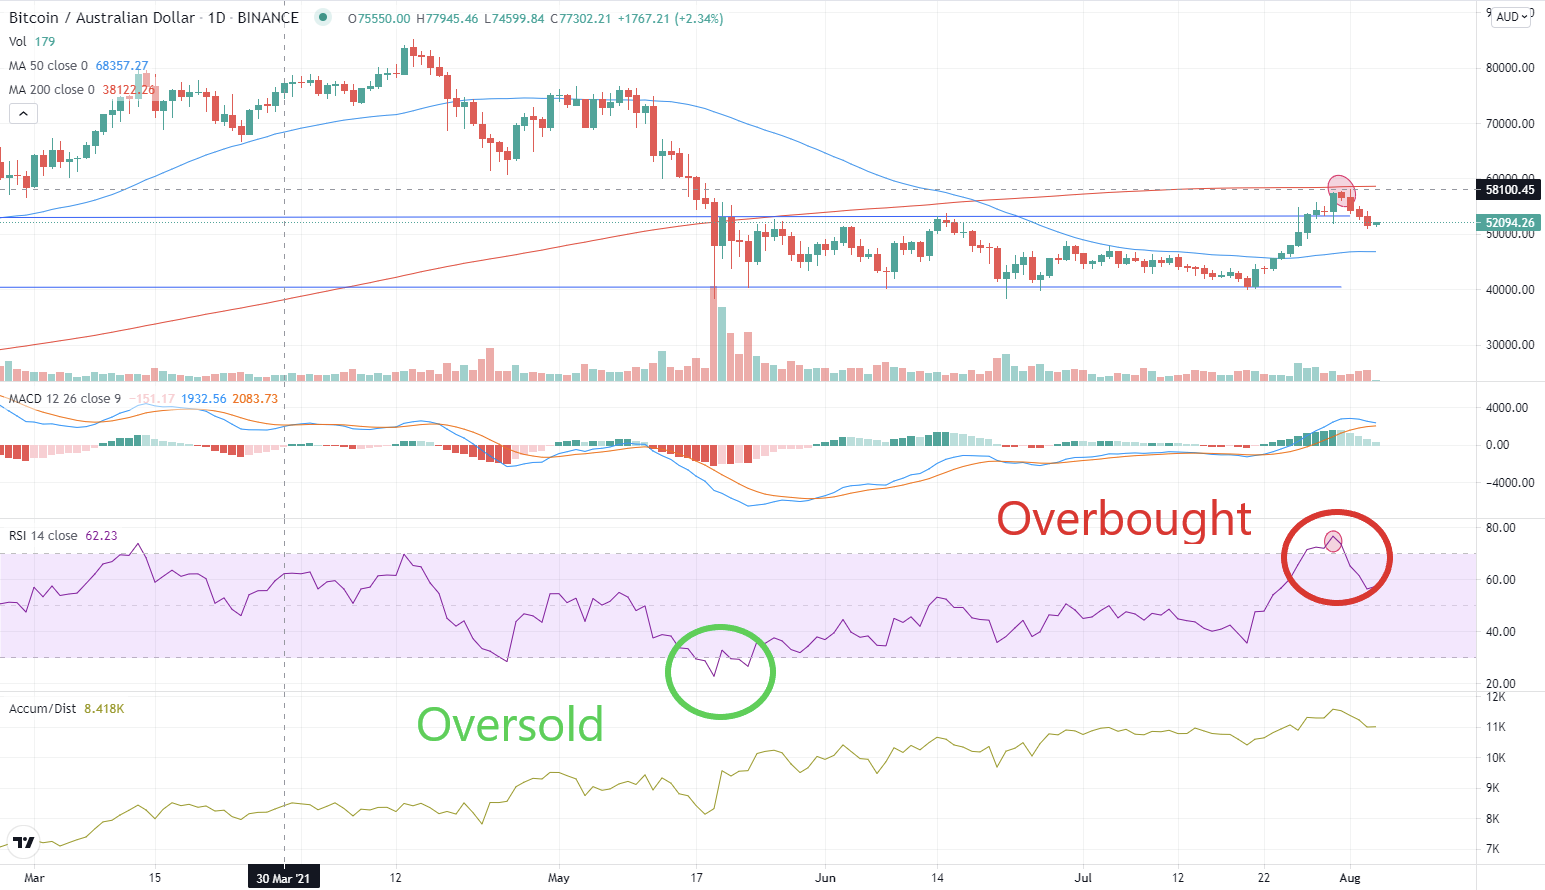 RSI for BTC/AUD indicating overbought and oversold conditions.
The RSI is like a barometer for the market’s mood swings. When it dips below 30, it suggests the market is oversold, akin to a pressure drop before a storm – a potential buy signal. When it rises above 70, it indicates the market is overbought, like high pressure signaling potential for a sell-off.
Why Traditional Indicators Might Not Be Enough?
Traditional indicators are invaluable, but each focus on a single aspect of the market, such as price action or momentum. This singular focus can lead to missed signals and incomplete insights. In the fast-paced and multifaceted world of cryptocurrency trading, there is a pressing need for a much more comprehensive approach.
Imagine trying to predict the weather with just a thermometer. You might get the temperature, but you'd miss the wind speed, humidity, and pressure changes. Similarly, relying solely on traditional indicators might give you some insight but won't paint the full picture.
Enter Whaleportal: A Comprehensive Trading Solution
Whaleportal takes market analysis to the next level by combining three critical components: live exchange data, sentiment analysis, and price structure. This trifecta provides a more complete picture of the market, enhancing your trading decisions.
Live Exchange Data
Buying and Selling Pressure Heatmaps: These heatmaps show real-time data on buying and selling pressure across various exchanges, allowing you to anticipate potential price movements before they happen.
 Example of buying and selling pressure heatmaps on Whaleportal
Imagine having a radar that detects where big money is flowing in real time. Buying and selling pressure heatmaps reveal the invisible currents beneath the market’s surface, showing where major trades are happening. This can be a game-changer in predicting price movements.
Sentiment Analysis
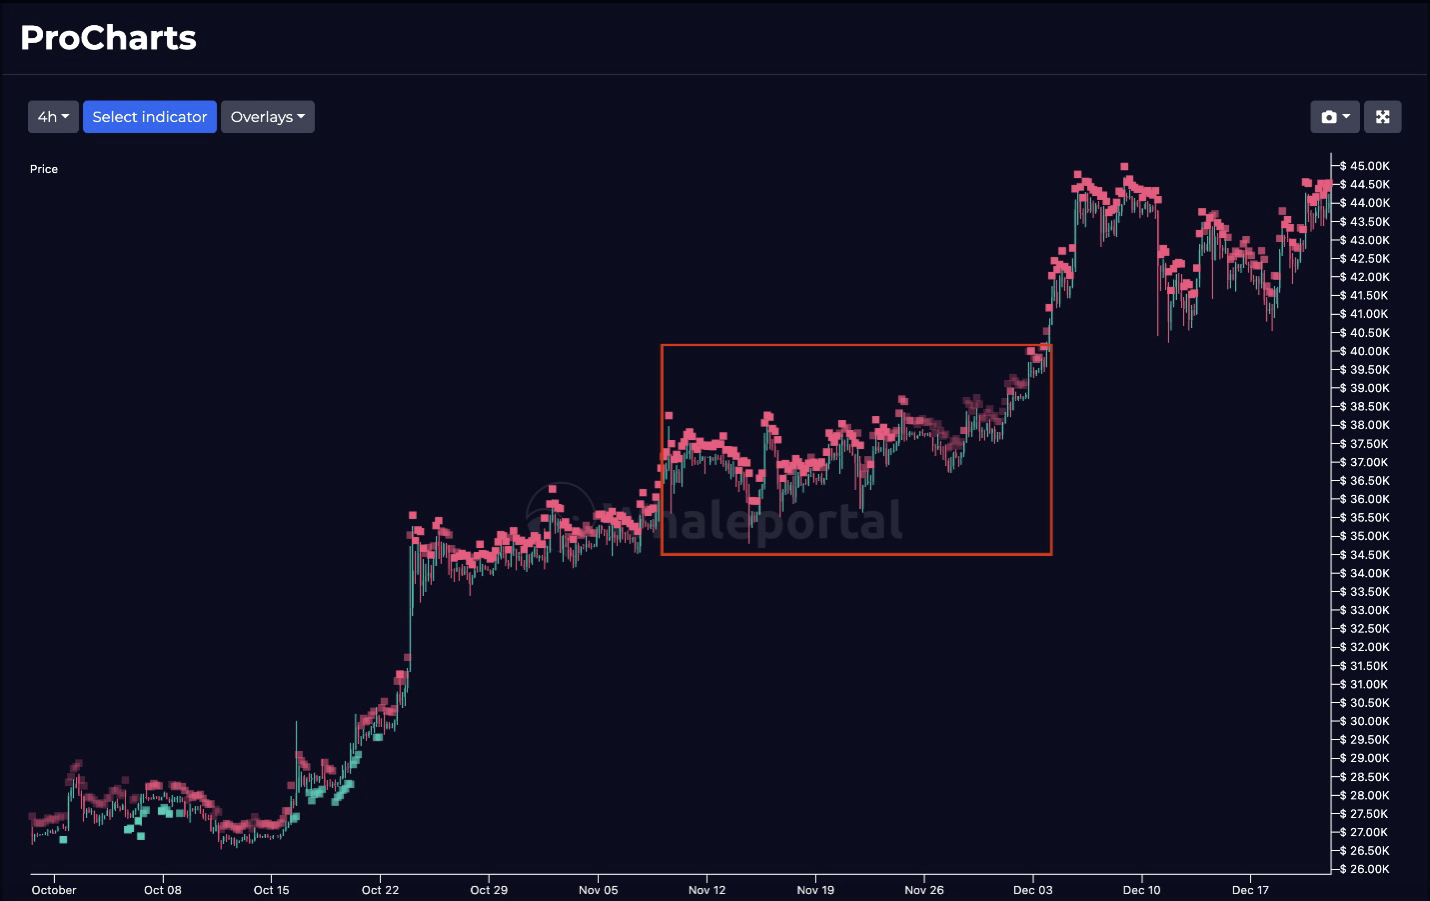
Sentiment Heatmaps: Sentiment heaatmaps on Whaleportal help analyze market sentiment, providing insights into how traders feel about specific cryptocurrencies. This can help you gauge market psychology and anticipate shifts.
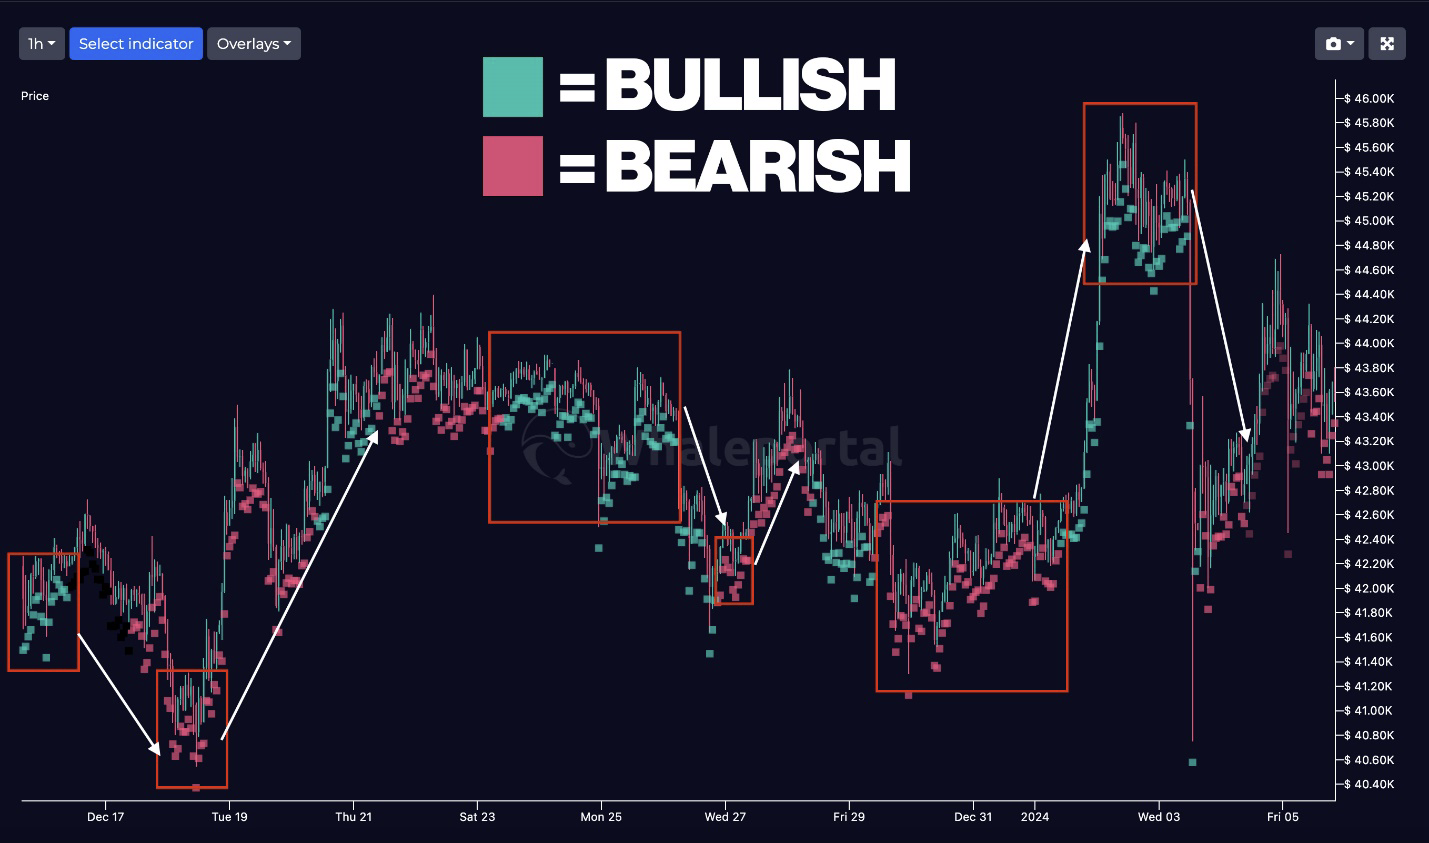
Sentiment heatmaps are like listening to the market’s pulse. They provide a snapshot of collective trader sentiment, showing whether the crowd is feeling bullish or bearish. Understanding this sentiment can help you anticipate shifts before they happen, like reading the mood of a crowd before a big game.
In the video below, you can see a visual explanation of using the sentiment heatmaps for your trading,
Price Structure
Volume Momentum Index and Momentum Waves: Unlike traditional indicators, Whaleportal analyzes the price structure by examining volume momentum and price waves. This offers a deeper, more nuanced understanding of market trends.
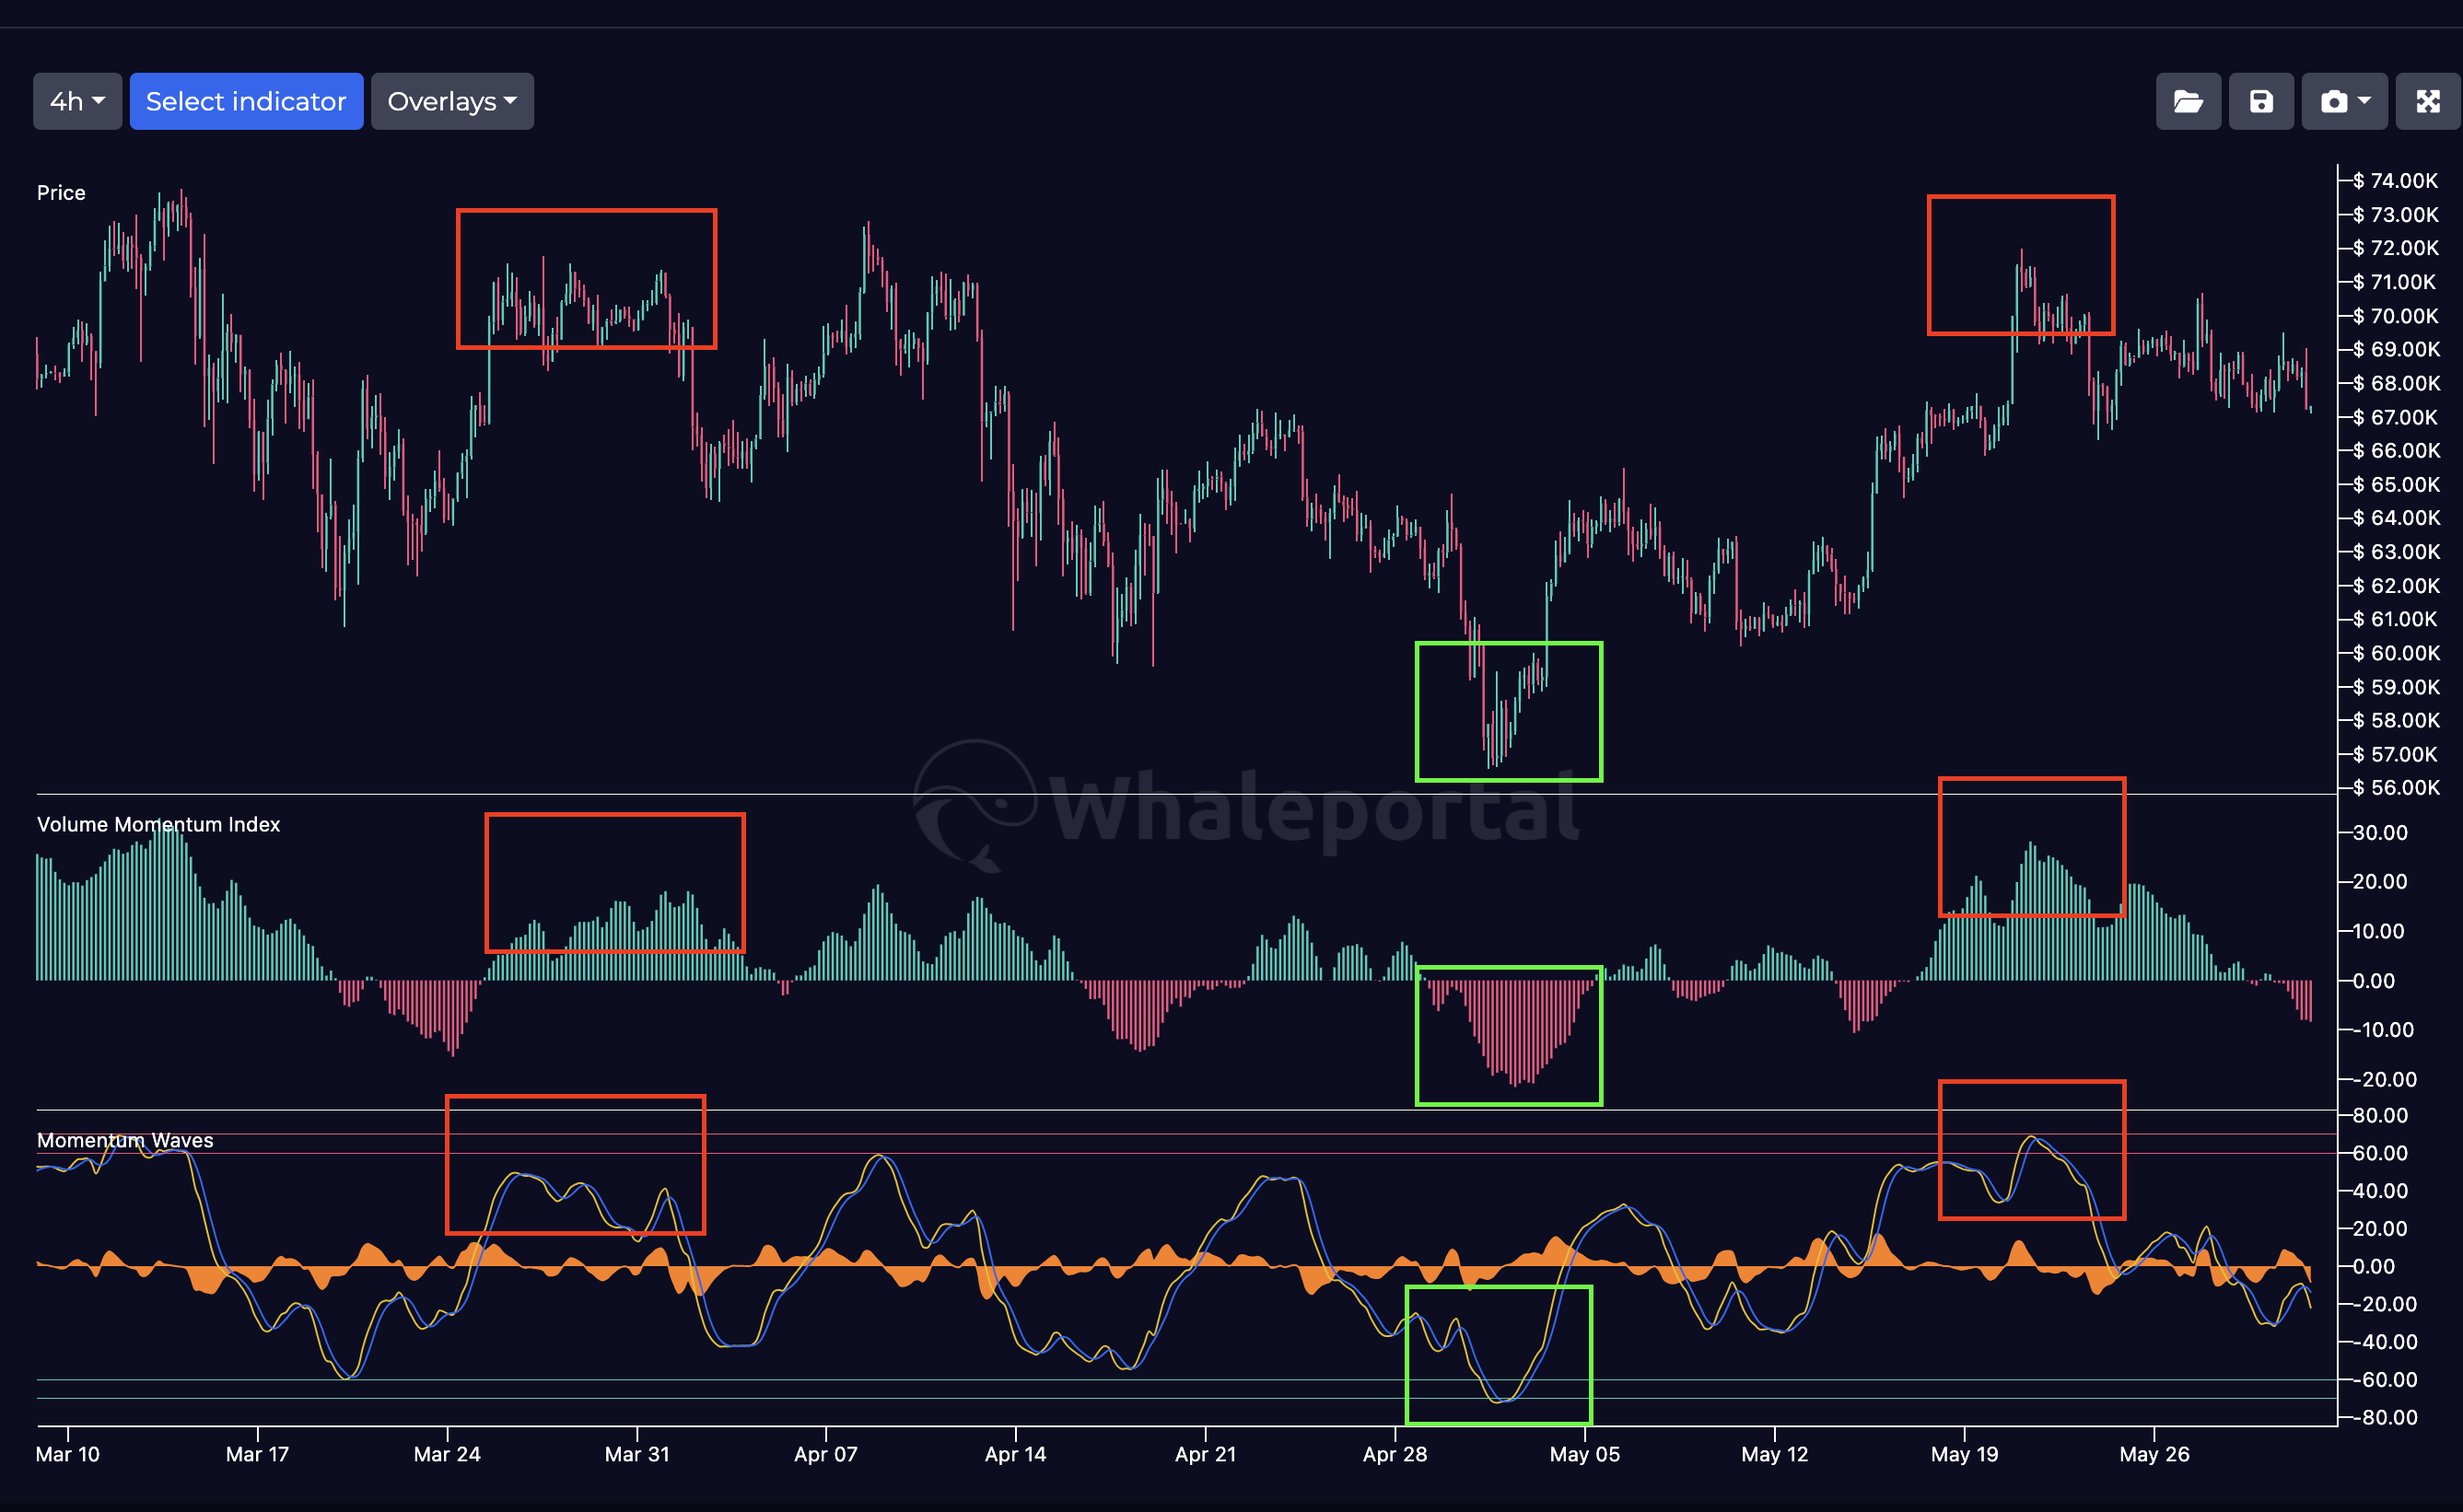
Price structure analysis is like studying the ocean’s wave patterns. The Volume Momentum Index and Momentum Waves give you insights into the strength and sustainability of price trends, helping you identify whether a trend is building up or losing steam.
The Trinity of Market Analysis
Combining the essentials of trading, live exchange data, sentiment analysis, and price structure, Whaleportal charts offer a comprehensive market view. This integrated approach significantly increases your chances of making informed trading decisions.
- Buying and Selling Pressure Heatmaps: Identify strong buying or selling interest areas, helping you anticipate price movements.
- Sentiment Heatmaps: Understand the market's emotional state, adding context to price movements.
- Volume Momentum Index and Momentum Waves: Gain detailed insights into trend strength and sustainability.
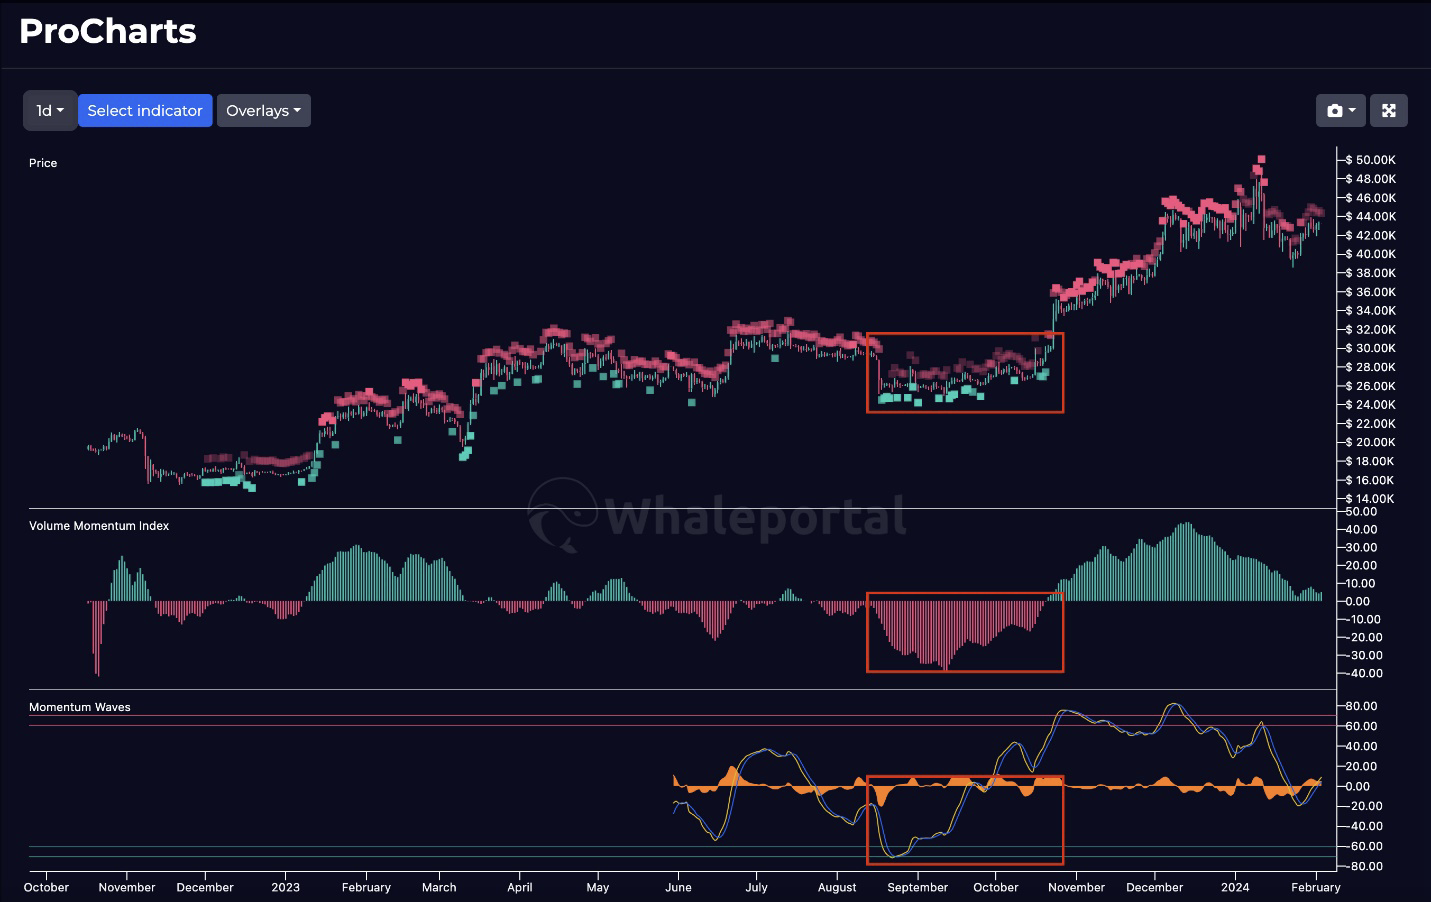 Example of Whaleportal charts integrating price structure, volume momentum index, momentum waves
This trinity approach ensures you’re not only relying on historical price data but also incorporating real-time market dynamics and sentiment, leading to more informed and effective trading decisions. It’s like having a full weather report with temperature, wind speed, and humidity – you get the complete picture.
Traditional indicators like Moving Averages, MACD, candlestick patterns, and RSI are valuable tools in any trader's arsenal. However, they often provide an incomplete picture of the market. Whaleportal charts, with their integration of live exchange data, sentiment analysis, and price structure, offer a more comprehensive and effective approach to market analysis.
There is a detailed video on how to use Whaleportal indicators in a trading strategy.