Crypto Fear and Greed Index: Why Smart Traders Buy Fear and Sell Greed
Crypto Fear and Greed Index Explained
Most traders panic when the market crashes and end up selling near the bottom. Meanwhile, experienced traders are already looking for the next opportunity. This is because experienced traders understand how to use the sentiment in their favor.
Profitable traders are not necessarily smarter intellectually, but they are emotionally. They watch crowd sentiment and do the exact opposite of what everyone else does: buy when others panic and sell when the market reaches peak euphoria.
In the crypto market, prices do not go up or down without a reason. This is what makes the index a useful trading indicator, as it reflects users' reactions to major events or announcements. Reacting to the FTX crash in November 2022, the Fear and Greed Index dropped into extreme fear, and Bitcoin also fell from $20,983 to $16,538 (-21.1%).
In our experience, relying solely on this indicator can help you discover prevailing sentiment among traders, but it is not always accurate. To fix this, we recommend combining the index with other effective crypto trading indicators.
For instance, using the Fear and Greed Index with whale tracking on Hyperliquid shows whether smart money is positioned against the current sentiment level.
Before we dive deeper, run a quick check by using the Whaleportal Fear and Greed Index to compare the current fear and greed level with the Bitcoin price.
What is the Fear and Greed Index
Many traders use the Fear and Greed index to identify the prevailing traders’ sentiment over a given period. The index measures sentiment on a scale of 0 to 100 and is available on crypto analytical platforms such as Whaleportal.
To measure fear and greed levels in a market, Whaleportal combines five key components that often affect the crypto market and assets’ prices:
- Volatility (25%): Measure Bitcoin's current volatility and max drawdown against its 30 and 90-day averages.
- Trading volume (25%): Analyze trading behavior, paying attention to open interest and growing volume on multiple exchanges.
- Social Media (15%): Track traders’ opinions on different social media platforms, including Twitter and Reddit.
- Market Composition (15%): Compare Bitcoin (BTC )'s current market capitalization to that of major stablecoins.
- Bitcoin Dominance (10%): Analyze whether liquidity is flowing into Bitcoin or altcoins
- Trend (10%): Carefully research the most searched words on Google and other search engines.
New and experienced traders use this result to predict the next trend or price movement, which is often the opposite of the current trend. So, when the index indicates extreme fear, it usually means that the market is in panic mode. Traders are cutting their losses, and crypto assets tend to become undervalued. This is potentially an opportunity to buy at a low price.
The reverse also works. When sentiment reaches an extreme level of greed, it means crypto assets are overpriced, and traders are getting more bullish. This usually leads to a temporary price increase before a correction. It is an opportunity to sell at a high price.
Though the crypto market has repeatedly followed this pattern in the past, it does not always confirm what to expect.
What The Fear and Greed Index Levels Mean
The Fear and Greed Index is measured from 0 to 100. The number represents different sentiment levels as shown below:
|
Fear & Greed Index |
Meaning |
Implications |
|
0-24 |
Extreme fear (red) |
Indicates a very bearish sentiment. Traders are panic-selling, and ‘crypto is dead’ is growing on X. |
|
25-46 |
Fear (amber) |
This implies that the market is still bearish, but the selling pressure is considerably lower. |
|
46-54 |
Neutral (yellow) |
Signals a stable market with low volatility and quiet accumulation. |
|
55-74 |
Greed (light green) |
At this point, the crypto market is getting bullish, and traders are starting to buy under FOMO. |
|
75-100 |
Extreme greed (green) |
Everyone is going all in on crypto with low risk management. |
How to Use The Fear and Greed Index in Your Trading Strategy
The index is used mainly as a short-term indicator because it captures current sentiment and how the market reacts to new events, global news, and major changes in market conditions. Note that it can also be used to predict future trends over a reasonable period.
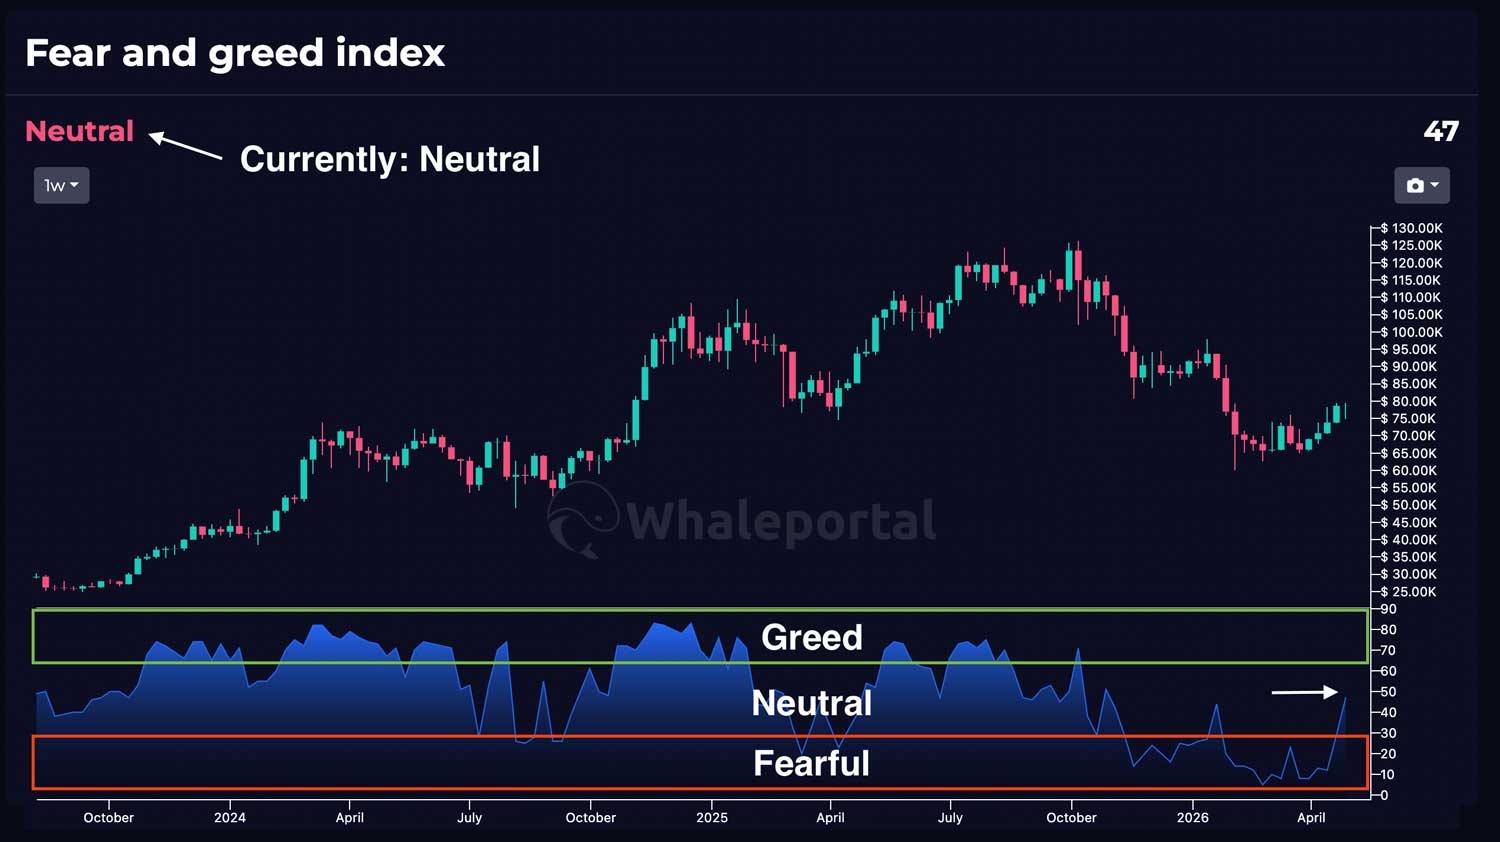
To do that, you need to identify clear patterns as you measure fear or greed in the market. We recommend using the Whaleportal Fear and Greed Index because it captures past levels of fear and greed, along with Bitcoin's trading price at each level.
Using the index as a leading indicator may also work for long-term investors who prefer to hold assets in their spot accounts. Still, it must be combined with other on-chain indicators to determine if the predicted trend is plausible. But generally, you want to buy in fearful emotional states and sell in greedy emotional states.
How to Use the Whaleportal Fear and Greed Index to Spot Trends or Reversal
- Step 1: Open the Whaleportal Fear and Greed Index
- Step 2: Adjust the metric to weekly or daily to access past data.
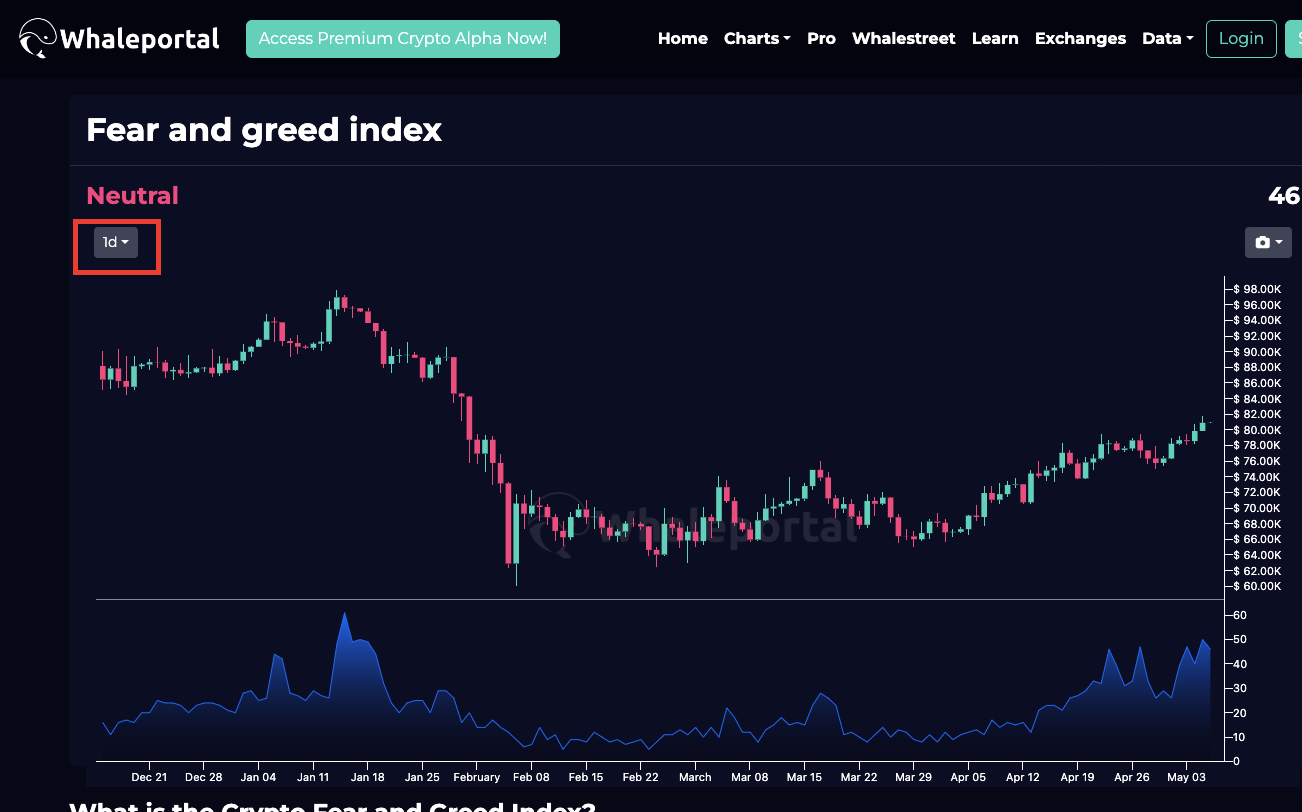
- Step 3: Hover over the chart to view the fear and greed level and the Bitcoin price.
- Step 4: Select additional crypto trading indicators to improve prediction accuracy and better understand market movement.
For daily leverage traders, it is important to understand that the market does not always move in sync with the index, especially when the index enters neutral or extreme zones. For example, Bitcoin hit $73,000 in March 2024 when the Fear and Greed index was at 91, signaling extreme greed. However, a major reversal only occurred in September 2024, when the Fear and Greed index fell to 26. This historical data shows that:
- The market can maintain a sentiment level for an extended period.
- The fear and greed index can predict future trends over a relatively long period (usually a couple of months).
Quick Tip: Extreme fear does not mean the bottom is instantly in, and extreme greed does not always signal a quick breakout because markets can stay fearful longer than expected. Always wait for confirmation from price action and other indicators before entering a trade.
Fear and Greed Index as a Contrarian Trading Guide
Most traders use the fear and greed index as a simple indicator of a bullish or bearish market. This fails to capture the true implication of extreme sentiment. At the extremes (extreme fear or extreme greed), the Fear and Greed index works best with contrarian theory. This implies going against the crowd sentiment.
When the fear and greed index signals extreme greed, it shows that the market is not driven by pure logic or standard indicators; instead, traders are drawn to crypto for big wins. This is when traders buy assets at the top and use high leverage with poor risk management. The higher the greed level, the greater the chance of correction or reversal.
How to Use The Fear & Greed Index As a Beginner
If you are trying the fear and greed index for the first time, we recommend running a backtest before applying your prediction to real trading. This enables you to discover the accuracy level and adjust your trading strategy accordingly.
As noted earlier, the Crypto Fear and Greed Index is an effective indicator, but it works best when you need to identify when market sentiment is extremely fearful (negative) or greedy (positive). However, market sentiment hardly moves from extreme fear to extreme greed within a few days; usually, that takes time. This implies that when the sentiment level is neutral, it may be difficult to predict the next moves using only this indicator.
At this level, you can combine the index with Whaleportal’s sentiment heatmap to get a clearer idea of how sentiment changes within the market daily. At whaleportal, we calculate the social sentiment per day, which allows you to take previous sentiment readings into account when executing trades.
Aside from the sentiment heatmap, experienced traders combine other indicators to gain a comprehensive understanding of the market.
The Best Crypto Trading Indicators to Use With Fear & Greed Index
Fear & Greed Index + RSI: Combined these indicators to identify market sentiment and measure the strength of the momentum that follows it.
Fear & Greed Index + BTC Dominance: The Fear & Greed Index measures BTC dominance. Confirming how capital is flowing into Bitcoin can help you size your portfolio.
Fear & Greed Index + Altcoin Season Index: Combine sentiment level with a review of altcoins' dominance to see whether capital is flowing into altcoins or Bitcoin. Useful if you are looking to gain exposure to the top 30 crypto assets.
Fear & Greed Index + Funding Rate: These tools reveal upcoming price reversals or corrections. An extremely positive funding rate (+0.1%) combined with an extreme greed index (75+) sounds bullish, but it usually doesn’t hold for long.
Fear & Greed Index + Price Action: When using the index for daily trading, combine it with price action in a clear Google Sheet or Excel file to see whether price action aligns with the sentiment level.
Conclusion
Using trading indicators remains one of the best ways to build an effective trading strategy that relies more on verifiable data than on emotions. With the Fear and Greed Index, you easily spot reversals and prevent getting caught in emotional moves.
After learning how to use the best crypto trading indicators, you should carefully identify which ones to combine before building a trading strategy. This can mean finding profitable entries for futures positions or using Dollar-Cost Averaging (DCA) to accumulate crypto assets in your spot account quietly.
Frequently Asked Questions
What is the fear and greed index?
The Fear and Greed Index measures market sentiment on a scale of 0-100. The market is in extreme fear when the scale is below 25; this is when traders panic-sell. When the scale is above 74, the market is at an extreme level of greed. This is when traders start buying aggressively.
Why is the Fear and Greed Index Useful for Traders?
The Fear and Greed Index is useful because it helps traders monitor sentiment level, particularly the two extreme levels (extreme fear and greed), to prepare for a potential reversal.
Can I use the Fear and Greed Index as a short-term or long-term indicator?
The index works best as a short- to mid-term sentiment tracker. If you are considering holding a crypto asset for the long term, the fear and greed index should be combined with other macro indicators to determine the best entry price or set up a proper DCA strategy.
What are the benefits of using the Fear and Greed Index as a beginner?
Using the fear and greed chart allows you to monitor traders’ emotions in both past and current markets, which is useful for identifying trading trends and patterns.
How can I predict Bitcoin price accurately?
You can’t predict it with 100% accuracy, but using a mix of crypto trading indicators (trend, volume, sentiment) can help you predict market direction and manage risk efficiently.
What is DCA?
DCA (Dollar-Cost Averaging) is a trading strategy that allows traders to buy crypto assets gradually over time to reduce the impact of volatility and lower the risk of buying at the top.